From one energy crisis to the next: How the EU cut gas demand by a fifth
Key Findings
The EU cut gas demand by about 20% between 2021 and 2024. One-third of this reduction was from households, as milder winters, lower heating demand in response to high prices, and heat pump deployment all appear to have played a role.
Those household gas savings are fragile. Much of them could reverse in a single cold winter.
Installing wind and solar power does not automatically cut gas use in the EU. Whether it does depends on the country: how much gas its power stations burn, whether wind power can be built alongside solar power, and whether homes and industry are electrifying heating.
The US–Iran war has disrupted maritime transit through the Strait of Hormuz, severely restricting oil and gas exports from the Middle East. For Europe, the 2026 crisis echoes the challenges of 2022, as the continent once again faces supply disruptions that threaten its energy security and push up prices. Following Russia’s full-scale invasion of Ukraine in February 2022, the EU launched its REPowerEU plan to phase out dependence on Russian gas. To effectively confront current and future crises, European countries must apply the lessons from REPowerEU policies.
A major lesson is that installing wind and solar power does not automatically cut gas use. Whether it does depends on the country: how much gas its power stations burn, whether wind power can be built alongside solar power, and whether homes and industry are electrifying heating.
The EU reduced its gas demand by approximately 80 billion cubic metres (bcm), or 20%, between 2021 and 2024. About 32% of this reduction came from households, 30% from industry, 28% from heat and power generation, and 10% from commercial/public services.
Germany (16.6bcm) and Italy (14.0bcm) combined accounted for nearly 35% of the total reduction between 2021 and 2024. France, the Netherlands and Spain followed, bringing the top five countries' combined contribution to roughly 56.5bcm (72%). At the other end, Poland registered the highest rise in gas use for heat and electricity production, likely as plants switched from coal to gas.
In terms of declines in household gas consumption between 2021 and 2024, Germany (7.0bcm), Italy (5.1bcm) and France (3.5bcm) reduced the most. Milder winters, energy efficiency measures, lower heating demand in response to high prices, and heat pump deployment all appear to have played a role.
Industrial gas use fell sharply in Germany (6.0bcm) and Italy (2.8bcm) over the same period, though it is unclear how much reflects genuine efficiency gains versus demand destruction from elevated prices or the relocation of energy-intensive activity.
The EU's gas demand reduction is real, with nearly every Member State contributing, but the volume is concentrated in a handful of large economies and is heavily driven by household behaviour.
Renewables gain ground in power generation
Wind and solar have taken a steadily larger share of EU power generation, though the amount of fossil fuel output that has been displaced varies sharply by country. Renewable energy accounted for 47.5% of gross EU electricity consumption in 2024, up 2.1 percentage points from 2023. Wind remained the bloc’s largest source of renewable electricity in 2024, contributing 38.0% of renewable generation, followed by hydropower (26.4%), solar (23.4%) and solid biofuels and other renewable sources.
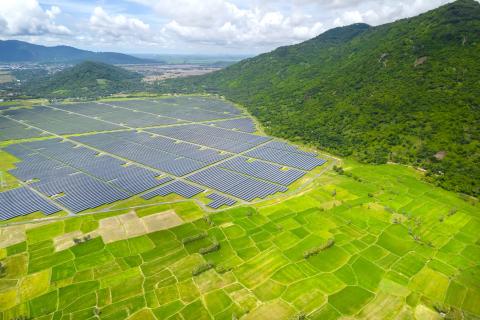
EU countries installed 146 gigawatts (GW) of solar photovoltaics over 2022–2024, led by Germany, Spain, Poland, Italy, France, the Netherlands and Austria, with utility-scale systems accounting for about 40% of that total. EU countries also installed more than 42GW of wind capacity over the same period, led by Germany, Finland, Sweden, France, Spain, the Netherlands and Poland.

Where wind and solar displaced gas, and where they did not
Electricity and heat generation covers electricity-only, combined heat and power, and heat-only units. “Heat” here means derived heat that is produced for sale rather than for the producer’s use.
Italy (5.5bcm), Spain (3.1bcm) and France (2.9bcm) led the decline in gas used for heat and electricity production. The rapid expansion of solar in particular, as well as improved nuclear availability in France, drove these reductions.
Despite Italy’s progress, it remains the largest generator of electricity from gas in the EU. The country is not achieving its potential to displace gas because permitting delays have restricted the wind build-out.
Across the EU, the clearest substitution of gas by wind and solar happened where gas was already playing a major role in power generation and where renewables could scale quickly.
Spain and the Netherlands show this most clearly. Both are among the bloc’s four largest gas burners for power generation. Between 2021 and 2024, Spain and the Netherlands reduced gas-fired generation by 27% and 22% respectively. Solar, wind and, in Spain’s case, hydro absorbed demand in both countries that gas plants would otherwise have met.
Finland is the clearest single-technology case. Cut off from Russian pipeline gas, it built more wind relative to its population than any other EU Member State. The country used wind to partially push gas and coal out of the power mix.
Portugal, meanwhile, used an already large renewables fleet to relegate gas to a dry-year back-up role, with renewables supplying almost 66% of the country’s electricity in 2024.
Where renewables grew but gas generation fell by a smaller amount or barely moved, the explanation is structural rather than a failure of build-out. Germany added more wind and solar than any other EU country over 2022–2024 yet cut gas-fired generation only modestly, because that capacity largely replaced lost nuclear output and displaced coal. The complete phase-out of gas for power generation is still not the German roadmap.
In Sweden, nuclear and hydropower already left gas a marginal power sector fuel, so new solar and wind had little gas left to displace. The gas that did fall out of this system came mostly from heat pumps and energy efficiency gains, not from the power sector.
In Poland and Bulgaria, new capacity has been competing with coal for market share, so renewables’ impact on gas generation is minimal.
In countries like Hungary and Czechia, where policy has restricted onshore wind, the pattern seen elsewhere in the EU of wind replacing gas-fired generation was simply not viable.
Heat pumps cut households’ gas use for heating
Clean electricity is not only replacing fossil fuels in the power sector but is increasingly penetrating heating demand through electrification, deepening the decline in Europe's gas imports and weakening the case for new fossil fuel infrastructure.
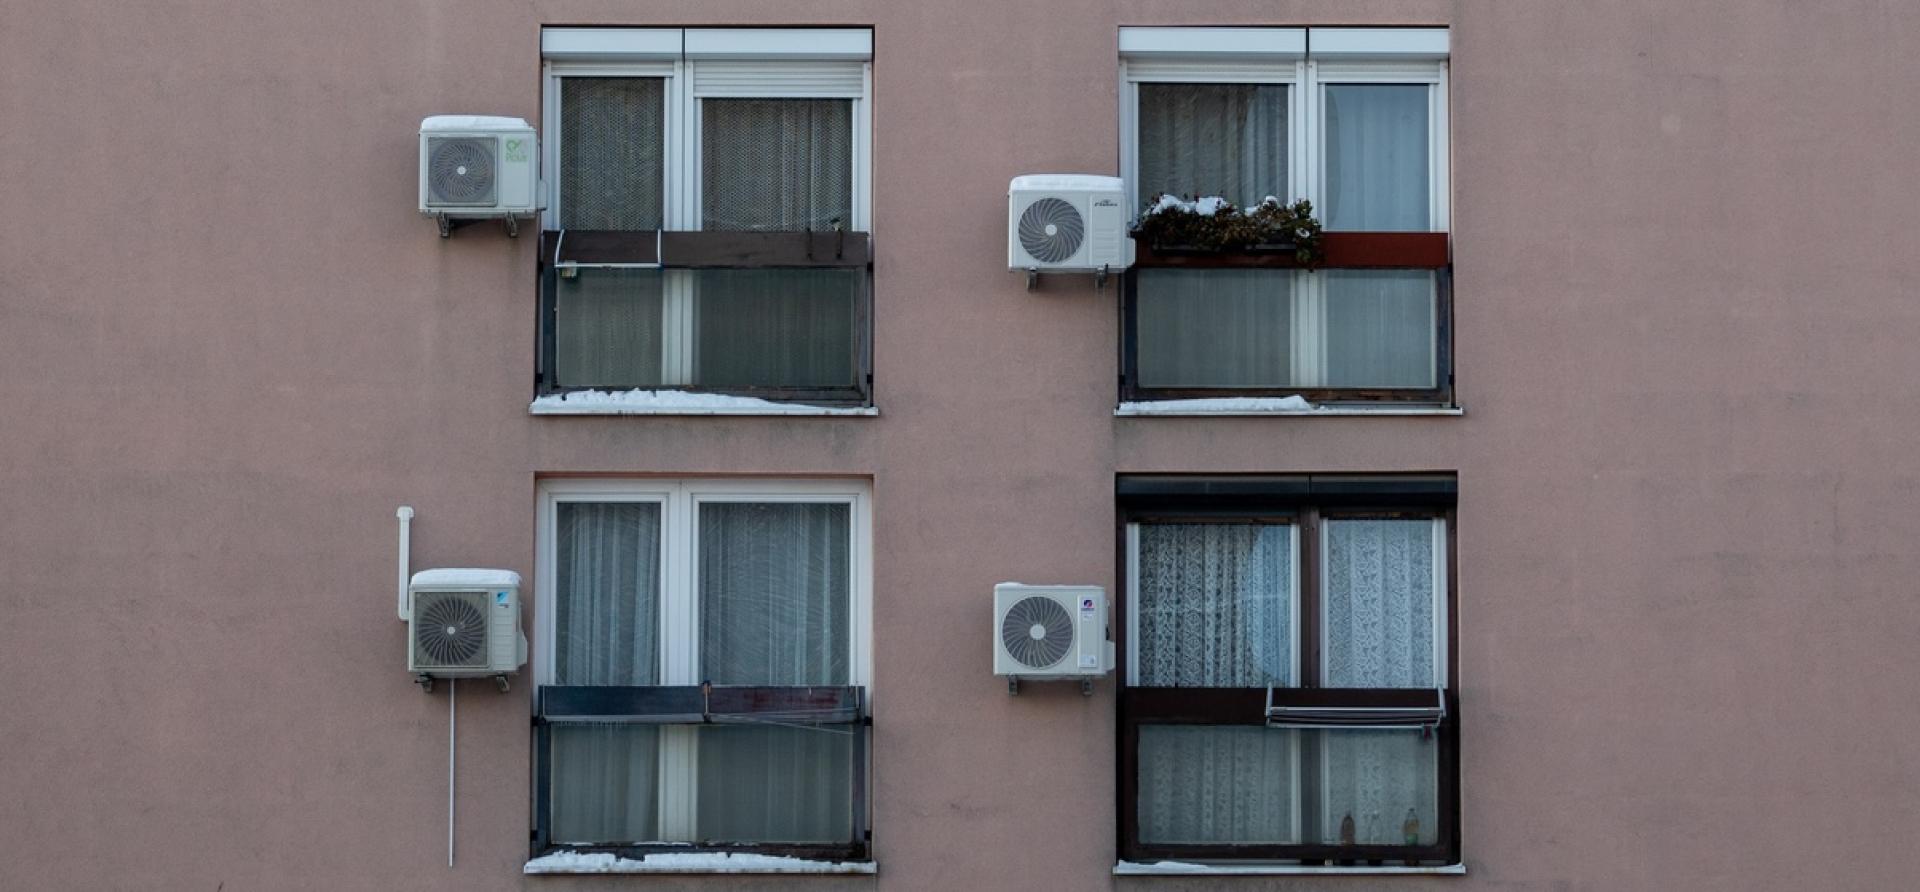
Heat pumps are central to that shift because they replace fossil fuel boilers with electric heating. Rather than burning fuel, they use electricity to transfer heat from the outside air, ground or water into buildings. They can deliver three to four units of heat for every unit of electricity consumed, depending on the system and operating conditions.
Heat pumps are key to enabling the clean energy transition, achieving the EU’s carbon neutrality goal by 2050, and reducing Europe’s dependence on imported fossil fuels. According to Eurostat data, about 50% of all energy consumed in the EU is for heating and cooling, and more than 70% of that still comes from fossil fuels (mostly gas). Several EU Member States introduced heat pump installation mandates, subsidy schemes and fossil boiler phase-out timelines that accelerated heat pump uptake, but some countries have reduced grant levels or ended programmes.
EU countries deployed around 7.8 million heat pumps over 2022–2024, according to the European Heat Pump Association. Around 2 million were deployed in France, around 1.5 million in Italy, almost 1 million in Germany, followed by Spain, the Netherlands, Poland and Sweden.
In the first six months of 2026, sales of residential heat pumps rose by 11% year on year in 12 European countries, driven primarily by energy market disruptions in the Strait of Hormuz. Nevertheless, an unusually cold winter could easily reverse much of the reduction in household gas demand.
Why combining wind, solar and heat pumps matters
Some EU countries are expanding wind and solar power alongside heat pumps to reduce fossil fuel use in electricity generation and heating. These technologies have complementary seasonal patterns: Solar output is higher in summer, while wind is stronger in winter, which is when heat pumps raise electricity demand. This combination can help meet winter heating needs, although energy storage, demand flexibility and sufficient grid capacity remain important for periods of low wind and solar output.
Deploying these technologies together helps EU countries build more resilient energy systems that hold up across the seasons and steadily reduce the continent's reliance on gas.


Related Content