India’s CCTS maps where industrial clusters could power the energy transition
Key Findings
India’s Carbon Credit Trading Scheme (CCTS) covers 748 industrial plants across eight sectors, and the 10 districts with the highest covered emissions hold 36.4% of the carbon from just 17% of obligated plants.
Eastern India accounts for 20% of the plants but 30% of the emissions and 36% of the reductions required in the first compliance cycle. Iron and steel drive most of that gap, with 106 of the 152 obligated plants in the region and close to three quarters of its emissions.
CCTS includes Scope 2 emissions, making clean power a direct compliance lever. Plants in the same industrial belt often face similar open-access rules and charges, making it easier to aggregate demand and procure clean power at scale.
As interstate transmission waivers are phased out, state-level open-access rules, charges, and storage policy will become increasingly important in determining whether industrial clusters can procure clean power competitively.
India’s Carbon Credit Trading Scheme (CCTS) covers 748 industrial plants across eight sectors, including 255 iron and steel plants whose targets are still in draft. The 10 districts of India with the highest covered emissions account for over a third of the scheme’s carbon, from just 17% of obligated plants. Most of this concentration is along India’s mineral-rich eastern states, driven by iron and steel. Clustered industrial demand for cleaner electricity could support larger, more financeable renewable energy and storage projects than individual plant-level procurement, provided targets are tightened over time and state-level policy on open access, wheeling charges, and cross-subsidy surcharges keeps pace.
In Chhattisgarh’s Raigarh, for example, a cluster of 16 steel plants accounts for 22.6 million tonnes of carbon dioxide (MtCO2), nearly 3% of the CCTS-covered emissions. The plants draw power from the grid of the same distribution company (discom) and face similar regulatory concerns when they seek cleaner electricity.
Raigarh is not unusual
The 10 districts with the most facilities nationally, led by Raipur in Chhattisgarh with 37 plants, Sundargarh in Odisha with 24, and Ballari in Karnataka with 21, hold 24.5% of CCTS-obligated plants. However, counting plants and counting carbon produce different maps. The 10 districts with the highest emissions hold 36.4% of the market’s carbon but only 17% of its plants, and they are not the same 10 districts. Eastern India (Odisha, West Bengal, Jharkhand and Bihar) accounts for 30% of covered emissions and 36% of the reductions required in the first compliance cycle. Iron and steel drive most of the gap, with 106 of the region’s 152 obligated plants belonging to the sector, accounting for nearly three quarters of its emissions.
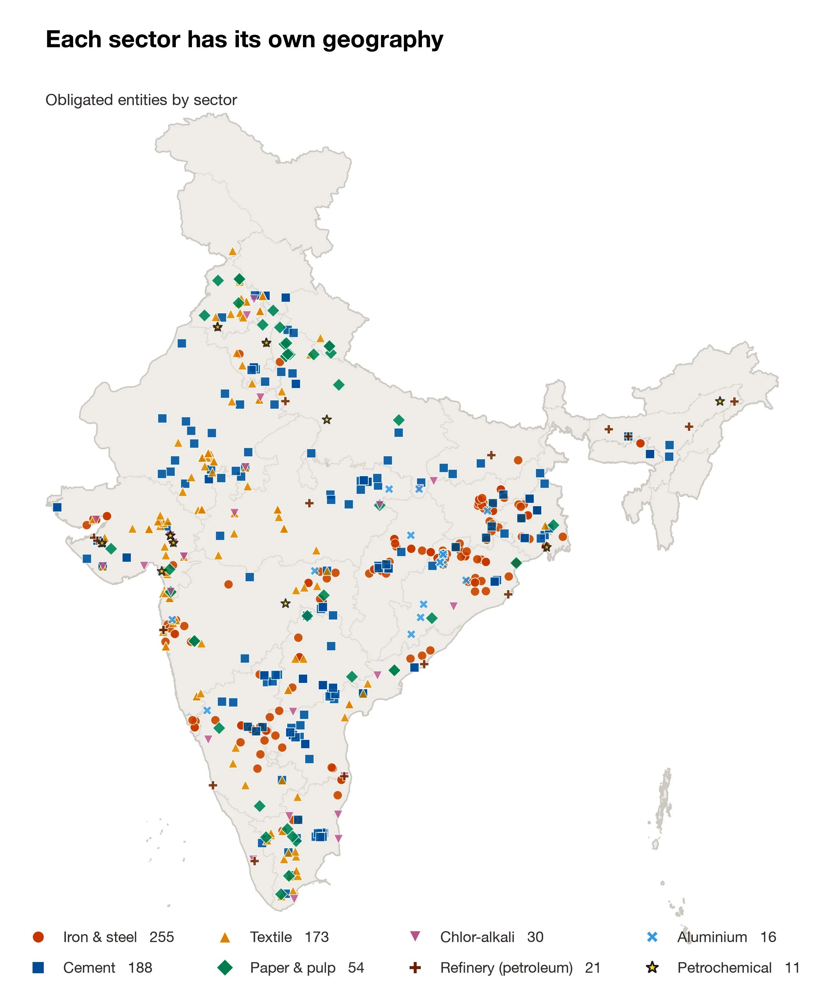
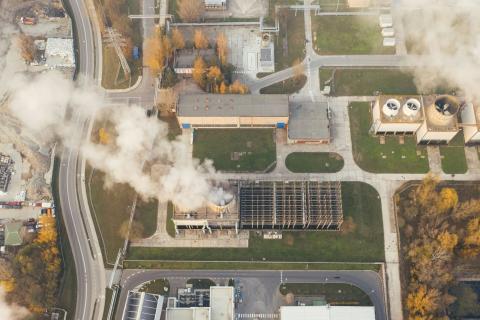
Image courtesy Orfonline.org/
CCTS’s carbon calculus
Industries have long clustered around raw materials and energy sources. The CCTS adds a new dimension: plants in these clusters now face a common incentive to reduce emissions.
The scheme measures emissions gate to gate, including indirect emissions from purchased electricity. A plant’s intensity therefore depends partly on its power supply. As power generation sits outside the scheme, Scope 2 accounting gives the CCTS an indirect route to influence electricity-related emissions. The scheme holds the grid emission factor constant between the baseline and assessment year within a compliance cycle, so a plant benefits from procuring cleaner power rather than from the grid getting cleaner around it. Thus, this makes clean power a compliance tool. As many obligated plants are clustered, their combined demand could support procurement at a larger scale.
This opportunity comes as India still needs to add roughly 200 gigawatts (GW) of non-fossil capacity to meet its 2030 target. India had 300.5GW of non-fossil capacity by July 2026, over 60% of its 500GW target, leaving roughly 200GW to add in four years. Since the Green Energy Open Access Rules of 2022 lowered eligibility criteria, corporate renewable procurement has grown quickly, with industry accounting for a large share of new clean capacity contracted outside the traditional utility relationship. For industrial buyers, however, individual demand may not always be large enough to support a dedicated renewable project. However, aggregating demand across several plants in the same cluster could create a stronger investment case. This is particularly important for the small sponge-iron units common in these clusters, many of which may struggle to sign long-term power purchase agreements on their own. Hence, pooling their renewable energy demand through industry associations is one of the recommended solutions.
The carbon market has produced a public list of industrial facilities that have a regulatory and potentially economic reason to procure clean power, to be mindful of how much carbon they emit, and roughly where each facility sits. In effect, it offers a rough map of where clean-power demand is concentrated and could deepen.
Shifts in the electricity market
Changes in the electricity market could strengthen this opportunity. The interstate transmission charge waiver for solar and wind projects is being phased out. Projects commissioned after June 2025 face progressively higher charges, with the full charge applying from July 2028. These charges currently average about ₹0.65 per kilowatt-hour (kWh), which is more than the difference in renewable generation costs between states (₹0.02–0.40 per kWh). As these charges return, the economics of supplying distant industrial loads from renewable projects in resource-rich states will change, potentially strengthening the case for generation and storage closer to demand centres. The Central Electricity Authority (CEA) estimates India will need over 400 gigawatt hours (GWh) of energy storage by 2031–32. For continuous-process industries, round-the-clock renewable supply remains costly. Ember, an energy think tank, puts its average cost at about ₹9.5 per kWh, mainly because of storage, but finds that meeting around half of a plant’s demand from solar and wind is already cost-effective. The carbon price adds relatively little at this stage, even at an estimated USD10 per tonne, a level suggested by early estimates, replacing one kWh of grid electricity with renewable power is worth only about ₹0.7 in credits. Procurement decision will therefore depend mainly on the cost of clean power relative to a plant’s current supply, with tightening CCTS targets eventually pushing plants further as each compliance cycle progresses.
Realising that potential, however, depends on policy outside the carbon market’s reach. Power generation accounts for nearly 40% of India’s emissions but sits outside the CCTS. The carbon price therefore neither shifts the merit order towards cleaner generation nor draws on power plants as buyers, which could otherwise be the market’s largest source of credit demand. Much of the adjustment therefore falls on industrial consumers, who must actively procure cleaner electricity. Open-access approvals remain slow in many states, while cross-subsidy surcharges and banking rules can materially affect the landed cost of renewable power. Coordination within a cluster requires knowing the number of entities and the scale of their collective demand.
For the Bureau of Energy Efficiency (BEE), this concentration shows where monitoring, reporting, and verification requirements will be greatest. It also shows where the next round of targets could have the biggest impact. Tightening them in these regions would affect national results more than doing the same elsewhere. For state governments, it highlights industrial centres where open-access reform, renewable procurement, and storage infrastructure could have an outsized effect. Chhattisgarh and Odisha, which host the largest steel clusters, could allow obligated plants in the same Discom area to buy renewable power jointly, bank surplus power as a group, and pay lower open-access charges on this pooled demand. Chhattisgarh’s waiver of transmission and wheeling charges for the first 500MW of green open access offers a precedent.
India has built a carbon market to price industrial emissions. It will prove just as useful for marking where the energy transition, and the scheme’s own next moves, carry the most weight.
This article was first published in ORF Online.


Related Content