Sightline/IEEFA update: U.S. fracking sector disappoints again

 August 19, 2019 (Sightline/IEEFA) ‒ A review of 29 major fracking-focused oil and gas companies revealed meager cash returns in the second quarter of 2019, according to a briefing note released today by Sightline Institute and the Institute for Energy Economics and Financial Analysis (IEEFA).
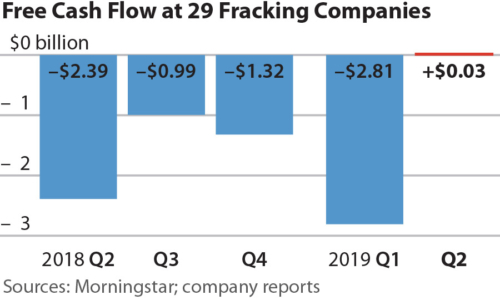
The report, U.S. Fracking Sector Disappoints Yet Again, notes that only 11 of the 29 companies under review registered positive free cash flows. All told, the 29 companies generated just $26 million in aggregate free cash flows—too little to make a significant dent in the more than $100 billion in long-term debt they owe.
“There were winners and losers this quarter, but overall, the oil and gas sector is still underperforming on virtually every financial measure,” said Clark Williams-Derry from Sightline Institute who co-authored the briefing note.
The analysts found that:
- U.S. fracking-focused oil and gas companies registered largely mediocre results during the second quarter of 2019
- The E&Ps reported only $26 million in free cash flows from April through June 2019, a modest amount compared to over $100 billion in the companies’ long-term debt
- Investors have soured on the sector, limiting the industry’s ability to tap into debt and equity markets.
Investors should continue to view the sector as highly speculative
“As underwhelming as these results were, they were an improvement over previous quarters,” said IEEFA director of finance Tom Sanzillo. “Still, investors would do well to remain skeptical and view the sector as highly speculative.”
Free cash flow measures the amount of cash generated by a company’s core business minus its capital spending. Sightline and IEEFA consider free cash flow a critical measure of financial health.
“Normally, positive free cash flow gives companies the ability to pay down their debt and reward stockholders, but so far, the fracking sector has been largely unable to achieve this,” said IEEFA financial analyst Kathy Hipple.
Much of the positive cash flow was attributed to one company in particular ‒ EOG Resources ‒ that posted $1.1 billion in free cash flow for the quarter, a turnaround of $1.5 billion quarter-over-quarter.
At the close of Q2 in 2019, the oil and gas sector was near the bottom of the Standard & Poor’s 500. By August 15, the sector hit rock bottom, with drilling, exploration and production and equipment and services leading the decline.
“Even the positive returns from EOG Resources failed to stop the downward slide of the company’s stock price,” said Williams-Derry. “Fracking remains a highly tenuous proposition for investors.”
Free Cash Flow, Selected E&Ps (Million U.S. dollars)
| Company | Stock Symbol | Q2 2018 | Q3 2018 | Q4 2018 | Q1 2019 | Q2 2019 |
| Apache Corporation | APA | 96 | 64 | (25) | (265) | 53 |
| Anadarko Petroleum Corporation | APC | (505) | 33 | 335 | (260) | (526) |
| Antero Resources Corporation | AR | (266) | (146) | 287 | 67 | (124) |
| Chesapeake Energy Corporation | CHK | (232) | (57) | (126) | (74) | (178) |
| Continental Resources | CLR | 11 | 98 | 175 | (32) | (21) |
| Cabot Oil & Gas Corporation | COG | 43 | (18) | 69 | 390 | 101 |
| Callon Petroleum Company | CPE | (79) | (41) | (4) | (119) | (16) |
| Carrizo Oil & Gas | CRZO | (59) | (64) | (301) | (46) | (15) |
| Concho Resources | CXO | 124 | (85) | (198) | (282) | (97) |
| Denbury Resources | DNR | 68 | 60 | 20 | (24) | 54 |
| Devon Energy | DVN | (48) | 236 | (78) | (182) | 116 |
| EOG Resources | EOG | 258 | 540 | 783 | (393) | 1,124 |
| EQT Corporation | EQT | (327) | (257) | (346) | 500 | 49 |
| Diamondback Energy | FANG | (192) | (173) | (1,407) | (411) | (154) |
| Hess Corporation | HES | (68) | (117) | 217 | (433) | 51 |
| Laredo Petroleum | LPI | (50) | (37) | (25) | (78) | 45 |
| Marathon Oil Corporation | MRO | 129 | 194 | 171 | (100) | 150 |
| Matador Resources Company | MTDR | (162) | (563) | (106) | (157) | (65) |
| Noble Energy | NBL | (499) | (110) | (130) | (235) | (78) |
| Oasis Petroleum | OAS | 22 | (77) | (74) | (63) | (74) |
| PDC Energy | PDCE | (62) | (58) | 45 | (90) | (25) |
| Pioneer Natural Resources Co. | PXD | 64 | (104) | (187) | (209) | (43) |
| QEP Resources | QEP | (186) | 27 | (78) | (87) | (36) |
| Range Resources Corporation | RRC | (113) | 20 | 26 | 47 | (14) |
| SM Energy Company | SM | (275) | (80) | (100) | (131) | (67) |
| Southwestern Energy Company | SWN | (82) | (17) | (30) | 184 | (227) |
| Whiting Petroleum Corporation | WLL | 99 | (67) | 48 | (47) | (9) |
| WPX Energy | WPX | (56) | (129) | (232) | (179) | 39 |
| Cimarex Energy Company | XEC | (43) | (66) | (50) | (100) | 13 |
| Total, selected E&Ps | (2,390) | (994) | (1,321) | (2,809) | 26 |
Clark Williams-Derry ([email protected]) is Director of Energy Finance for Sightline Institute
Tom Sanzillo ([email protected]) is IEEFA’s director of finance
Kathy Hipple ([email protected]) is an IEEFA financial analyst
Full Report: U.S. Fracking Sector Disappoints Yet Again
Media Contacts: Vivienne Heston ([email protected]) +1 (914) 439-8921
Anne Christnovich ([email protected]) +1 (206) 498-1887
About Sightline
Sightline Institute is an independent, nonprofit research and communications center. More can be found at www.sightline.org.
About IEEFA
The Institute for Energy Economics and Financial Analysis conducts research and analyses on financial and economic issues related to energy and the environment. The Institute’s mission is to accelerate the transition to a diverse, sustainable and profitable energy economy. www.ieefa.org