IEEFA U.S.: Wind farms are forever
When the Lake Benton II wind farm in southwestern Minnesota was taken offline this past October after 20 years of service, the shutdown made news for its novelty. Wind farms are being built these days, not closed, and Lake Benton II was supposed to last until 2029.
AT AROUND THE SAME TIME THAT THE 100-MEGAWATT (MW) WIND FARM MADE HEADLINES, AES Southland retired a 506MW gas-powered unit at its Los Angeles-area Redondo Beach plant, which was commissioned 70 years ago. Exelon Corp. had just retired the 820MW, 45-year-old nuclear plant at Three Mile Island in Pennsylvania, and the operators of Navajo Generating Station in Arizona had closed a 750MW unit as part of a phased shutdown that took the entire 2,250MW plant offline in November. The 630MW Unit 3 of the coal-fired, 39-year-old Baldwin Energy Complex in Illinois was retired in September, as was the 100MW Nucla coal plant in Colorado, after 60 years of operation.
But Lake Benton II was different. Indeed, timing is the only thing the Minnesota wind farm has in common with all those other plants, none of which are coming back.
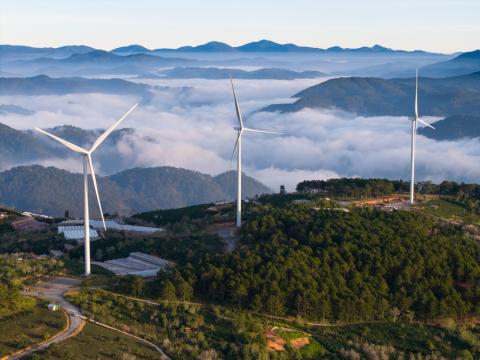
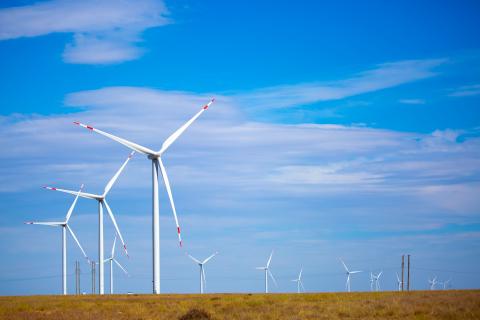
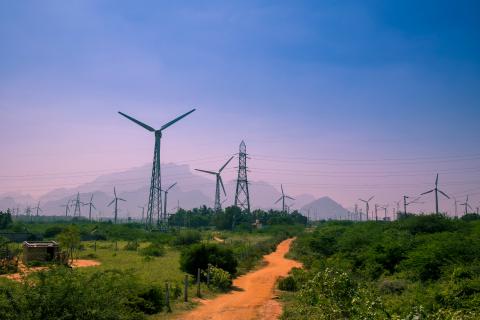
The Lake Benton wind farm is being reconfigured now with 44 higher-performing turbines to replace the original 138. With a generation capacity of 100MW, it is not a gigantic wind farm, but it is a prime example of a resilient and booming industry that shows no sign of slowdown in its growth and that persists in part because wind farms seldom ever die. They are typically just retooled—“repowered” in industry terms—with new hardware that gives them another 20 or 30 years of life. Rarely is a wind farm ever truly decommissioned (see this 2013 report by the National Renewable Energy Laboratory and this item from the American Wind Energy Association).
 MOMENTUM AROUND U.S. WIND-POWERED ELECTRICITY WAS DETAILED MOST RECENTLY in an update published in December by the Energy Information Administration (EIA) showing that wind-generation capacity in September hit 100GW nationally, a first. That milestone marked a more than doubling in capacity since 2012 and a roughly 300 percent increase over the past decade.
The agency—and others—see the trend accelerating. The EIA hasn’t compiled fourth-quarter 2019 data yet but said it expected an additional 7.2GW of wind generation to come online in December alone (EIA analysts note that more projects are commissioned toward the end of calendar years because developers rush to take advantage of expiring tax credits). The EIA is projecting that an additional 14.3GW of capacity will be installed in 2020, meaning that over the course of a year or so the 100GW recorded in September will have been eclipsed by more than 20 percent, a gain that suggests runaway momentum.
The EIA dispatch included several other nuggets of note:
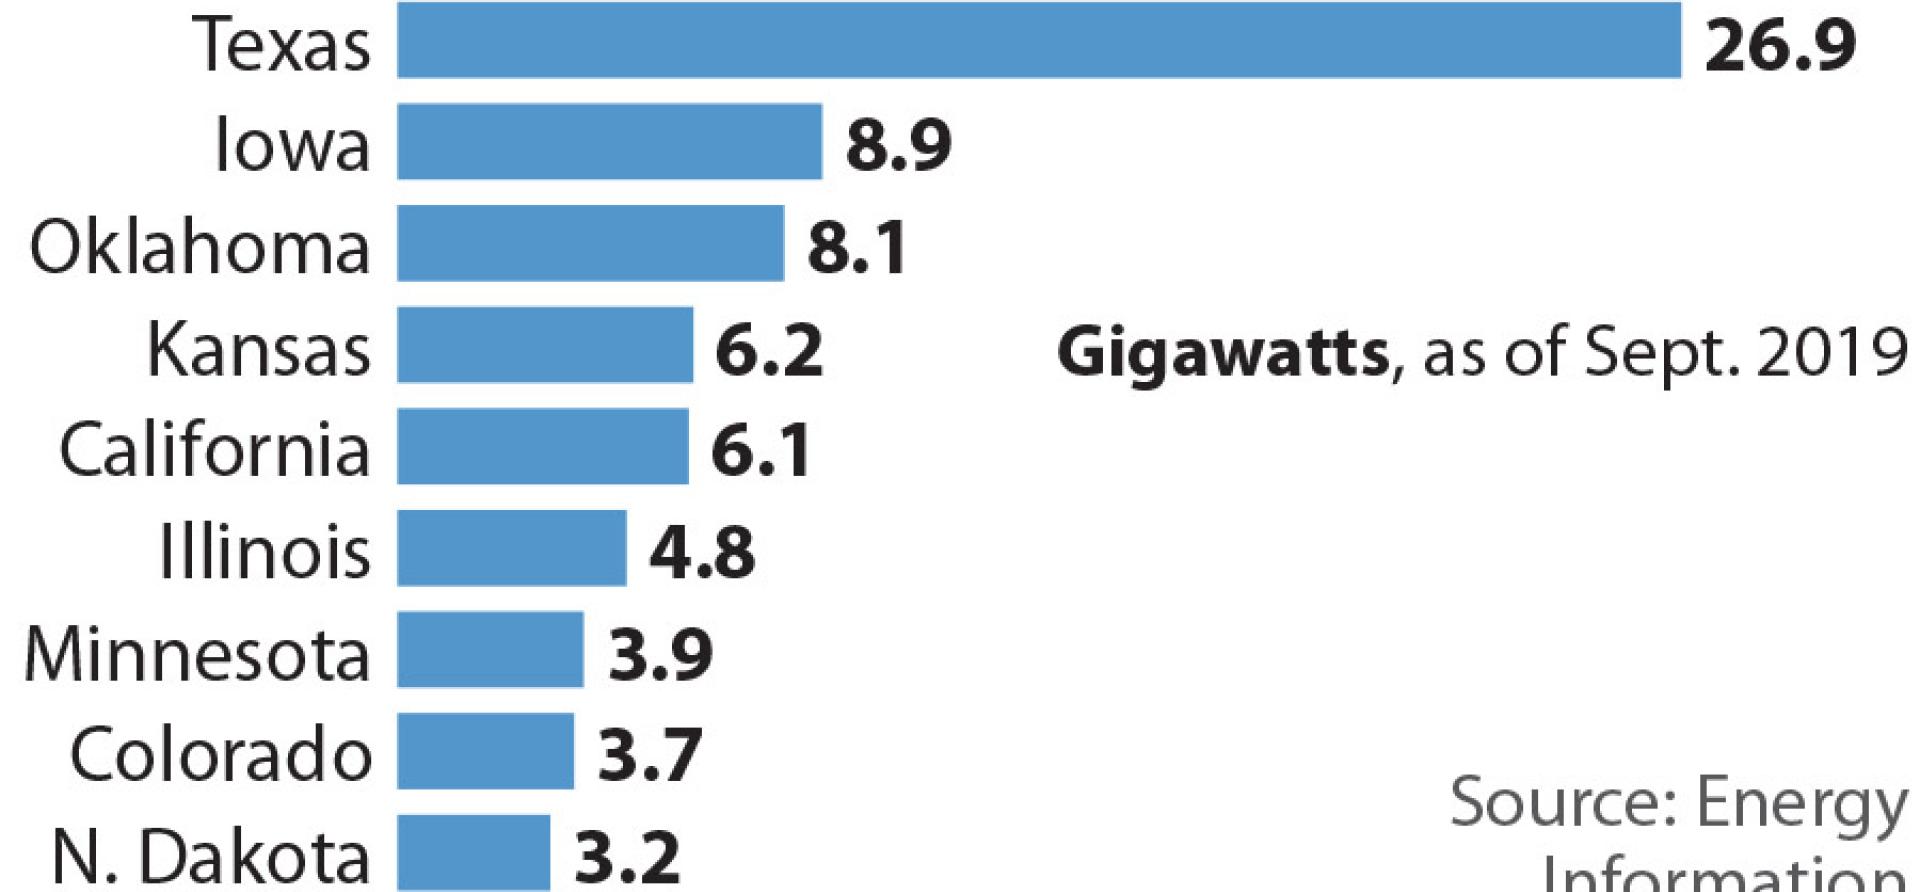
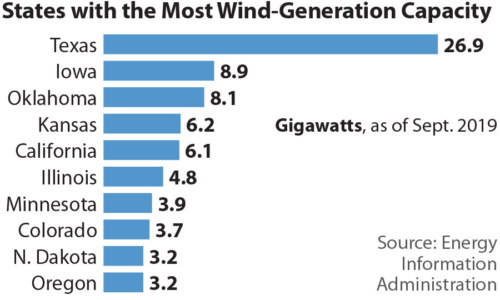
- Kansas has pulled ahead of California, 6.2GW to 6.1GW in overall wind generation capacity, a strong indicator that the recent uptake of wind is being driven more than ever by economics and not public policy, as it was 30 or 40 years ago when California was the epicenter of the wind industry.
- Texas, Iowa and Oklahoma continue to lead in installed capacity, accounting, respectively, for 26.9 percent, 8.9 percent, and 8.1 percent of national wind-powered generation, although Illinois (4.8 percent), Minnesota (3.9 percent), Colorado (3.7 percent), North Dakota (3.2 percent), and Oregon (3.2 percent) are up-and-coming.
- A little more than a quarter of all wind-powered electricity nationally is scattered now across 32 other states, suggesting that the appetite for wind farms knows few geographic bounds.
Analysts say wind and solar will give even gas-powered generation a run for its money
Analysts at Morningstar are bullish on the “exploding sector of renewable power,” arguing that wind and solar, while continuing to diminish the role of coal, will give even gas-powered generation a fierce run for its money, which is actually already happening. In an analysis published last week, S&P Global Market Intelligence calculated that wind and solar accounted for 52 percent of all new U.S. power generation in 2019, compared with 46 percent for gas (hydro accounted for the remaining 2 percent)—a sharp turn considering that in 2018 gas-fired generation’s share of new capacity totaled 78 percent.
Morgan Stanley in December cited a “second wave of renewables” as the driving force behind coal’s share of the market likely dropping to 8 percent by 2030 from 27 percent in 2018.
Global trends show where the U.S. is going. Bloomberg New Energy Finance in a Jan. 16 report estimated renewable energy investment worldwide at $282.2 billion in 2019, up from $280.2 billion in 2018. BNEF divided the activity almost evenly between wind and solar. While the U.S. wind industry is well out in front of utility-scale solar, the gap is closing, in part because utility-scale projects are increasingly being coupled with new battery-storage technology.
Technological advances also explain wind’s gains. Over the past 10 years, average turbine capacity, according to S&P Global Market Intelligence, has risen to 2.73MW from 1.66MW. Average rotor diameter has increased to 123 meters from 78 meters, capacity factors have risen to 33 percent from 27.8 percent, and the current pipeline is estimated at 3.7MW and average rotor diameter at 135 meters.
ONE RESULT OF THESE ADVANCES IS THAT NEW OR REPOWERED WIND FARMS CAN PRODUCE MORE POWER WITH FEWER TURBINES, a business model that builds on a winning formula with zero fuel costs. Manufacturers, seeking to leverage that advantage, are also customizing turbines to take into account regional wind speeds.
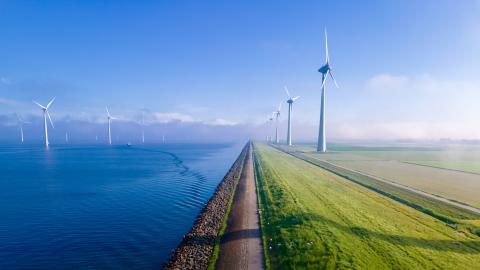
Technology is at work on the offshore front as well. The average offshore utility-scale turbine in 2010 had a capacity factor of 3MW and was about 100 meters tall. The International Energy Agency predicts that by 2030 turbines will exceed 250 meters in height “with nameplate capacities of 15MW to 20MW.” GE, the biggest supplier to the U.S. market, has just rolled out a 12MW turbine.
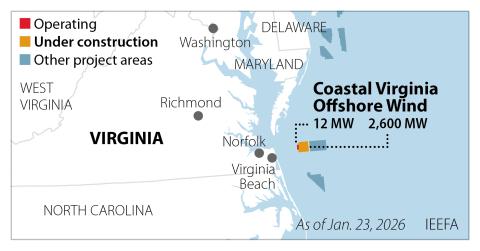
While the U.S. has lagged in its uptake of offshore resources, that is changing. In Virginia, Dominion Energy is developing 2,640MW of offshore wind generation. New York, which last year mandated the offshore buildout of 9,000MW of wind capacity and in October signed contracts with two companies for completion of 1,700MW by 2024, is opening a trade school that aims to graduate 2,500 wind technicians over the next five years. Regulators in Connecticut are weighing bids to build 2,000MW of capacity off the state’s coastline.
Markets for renewables are being driven by the utility industry itself
Bigger markets for renewables are being driven as well by new policies within the utility industry itself. Tri-State Generation and Transmission Association, a 44-member group of co-ops in the Rocky Mountain West, announced last week that it would speed up the shutdown of coal plants in Colorado and New Mexico alongside plans to replace much of that output with almost 1,000MW of rural solar and wind capacity. In a similar but much larger initiative, PacifiCorp., a regional utility based in Oregon, will build 4,600MW of wind-generation capacity (and 6,300MW of solar) across five states. Minnesota-based Xcel Energy, which is bigger than PacifiCorp., is closing two coal-fired plants in southeastern Colorado and replacing that capacity with 2,075MW of renewables, about equally divided between wind and solar. Xcel’s plan is part of a strategy that emphasizes investing more in Texas wind assets and eliminating its coal-fired generation across the upper Midwest.
Meanwhile in Minnesota, the repowering of Lake Benton II is happening as two even newer nearby projects—50MW Jeffers, commissioned in 2008, and 30MW Community Wind North, commissioned in 2011—are also being retooled so that each generates a bigger bang for its buck. The Minnesota examples are among many indicators across the country that the wind industry has legs.
Another indicator: An announcement two weeks ago by Xcel subsidiary Northern States Power that it is seeking regulatory approval to run its two remaining Minnesota coal-fired plants, the 511MW Allen S. King power station and 682MW of the 2,238MW Sherburne County Plant, on a seasonal basis instead of year-round. This is a clear signal that wind facilities such as Lake Benton II are winning the race against coal.
Karl Cates ([email protected]) is an IEEFA energy transition policy analyst.
Related items:
IEEFA U.S.: EIA puts its stamp on the electricity-generation transition
IEEFA U.S.: The coal rebound that didn’t happen
IEEFA update: New Mexico emerges as a proxy for the U.S. electricity sector transition

