IEEFA U.S.: The coal boom that wasn’t

 Preliminary 2021 data from the Energy Information Administration confirm what IEEFA said throughout the year: The long-term-trend in U.S. utility generation continues to move away from fossil fuels, particularly coal, and toward greater renewable energy use.
Last year’s coal narrative used the historically low generation totals from 2020 to tout a supposed boom in demand. Coal did indeed recover some market share from its pandemic-induced lows last year—but by November and December, the recovery had evaporated and the fuel’s market share fell below 2020 levels. Not only did coal’s market share fall below 20% for those two months (a level not breached before the pandemic’s arrival in 2020), but it did so despite much higher gas prices and a recovery in power demand. If coal can’t muster a sustained recovery in such conditions, it leaves no doubt that the long-term trend remains the same—downward.
On an annual basis, coal’s market share was about 22.6% in 2021, down from 23.3% in 2019, although up from just 19.9% in 2020. This result continues a trend that began in earnest in 2010, with coal-fired generation’s share falling by half since then.
This decade will see the decline continue, pushed by two interrelated drivers:
The long-term trend remains the same—downward.
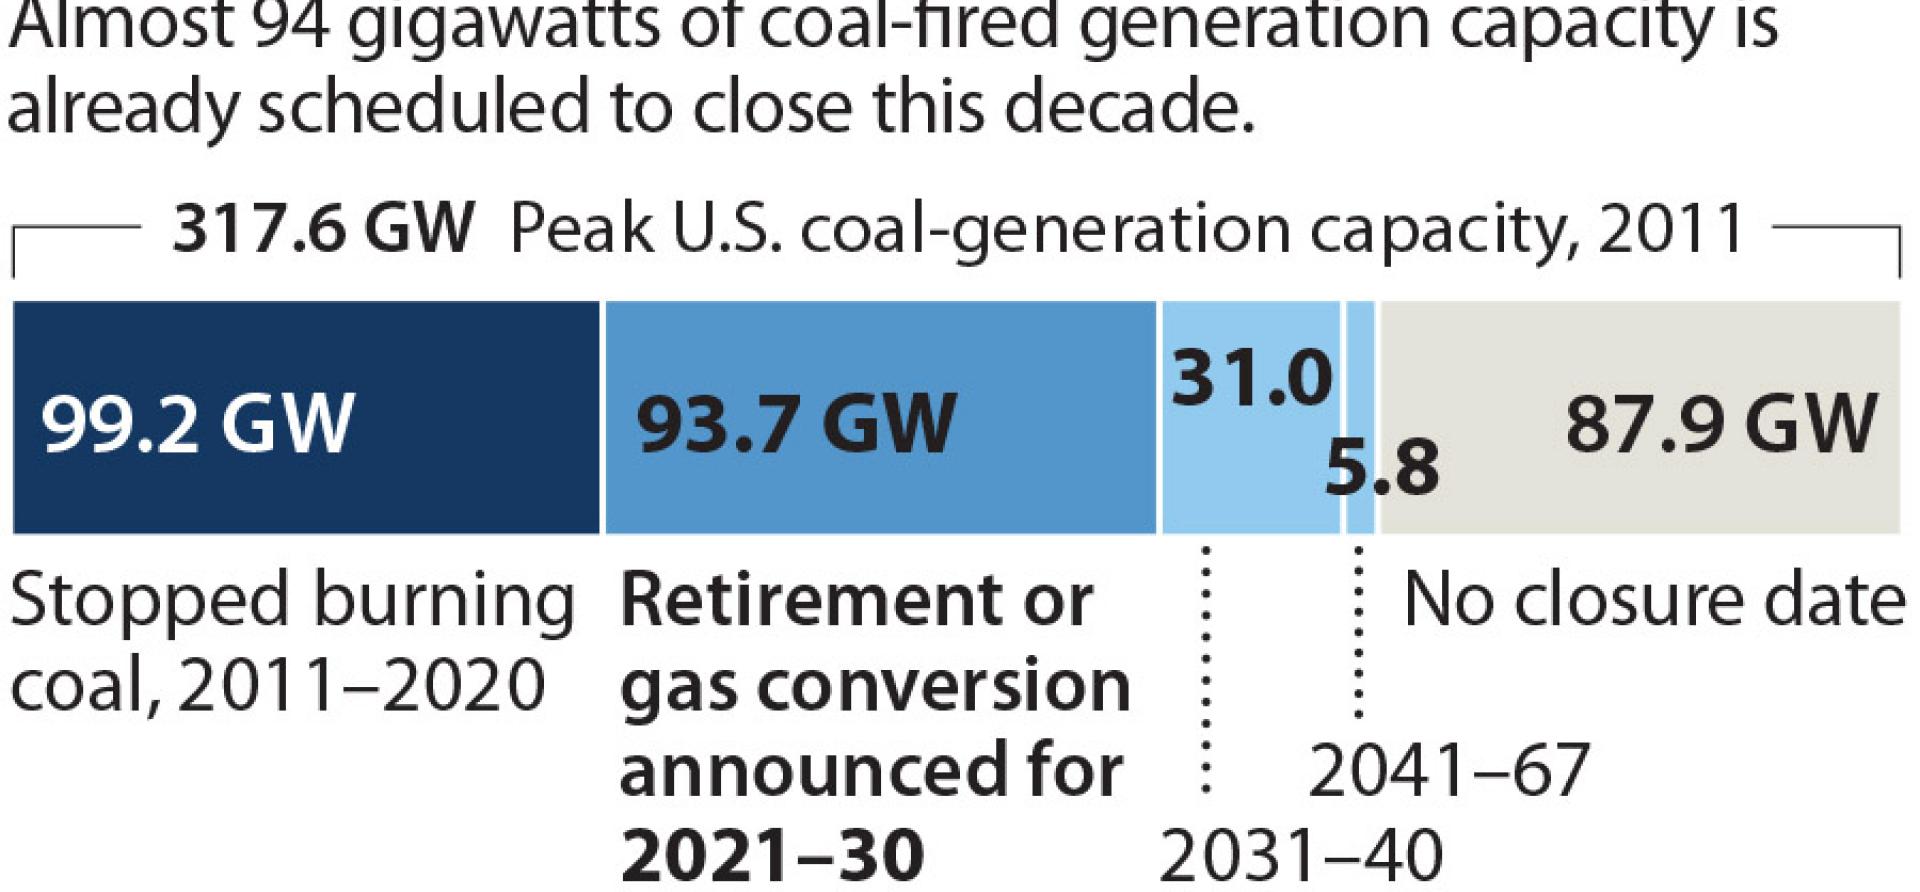
FIRST, THE UTILITY INDUSTRY IS MOVING AWAY FROM COAL AT AN ACCELERATING PACE. In March 2020, announced coal plant retirements through 2030 totaled 37.4 gigawatts (GW). By the end of 2021, that total had jumped to 93.7 gigawatts, about 45 percent of the existing coal-fired generating capacity. Looking further out, an additional 31 GW of coal-fired capacity is already set for closure from 2030-40. Both totals are certain to grow, since almost half of the roughly 88 GW of capacity with no announced retirement dates is already at least 40 years old, putting those plants at the tail end of their operating lives.
At the same time, the plants still operating are doing so less and less, as shown in data from the Energy Information Administration. In 2019, coal’s market share topped 30 percent on 12 days and only fell below 20 percent on 30 days. By 2021, the number of days coal’s share was above 30 percent fell to just five, and fell below 20 percent on 99 days.

The trends are clearly evident in utility decisions about specific coal plants. In Colorado, for example, Xcel’s Public Service of Colorado subsidiary has pledged to progressively cut output at its trouble-plagued Comanche Unit 3 to no more than 33 percent by 2029 and close the 750-megawatt unit entirely by the end of 2034. Similarly, Arizona Public Service said last year it would move to seasonal operations at one of the two units at its 1,540MW Four Corners coal plant in the fall of 2023 before closing the facility entirely in 2031.
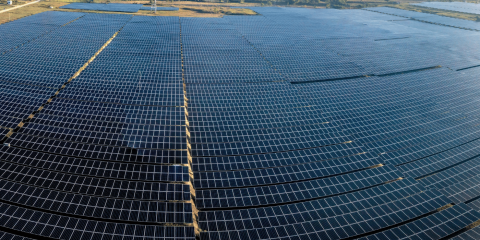
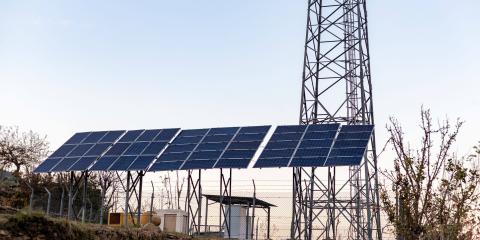
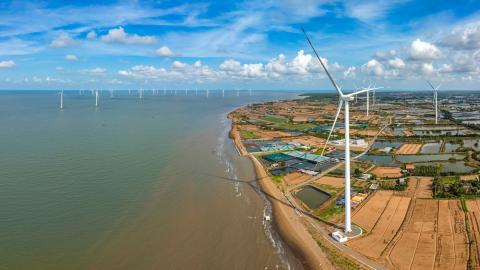
THE SECOND DRIVER IS THE RAPID ADDITION OF WIND, SOLAR AND BATTERY STORAGE RESOURCES, now cheaper than coal across the board. In just two years, total wind generation climbed 28 percent to 83.8 million megawatt-hours (MWh) while solar rose 45 percent to 48.5 million MWh. During that same span, coal fell by 64 million MWh and gas generation dropped by 37 million MWh.
The impact of the wind and solar generation increases is evident in their rapidly rising share of the U.S. electricity market: Wind and utility-scale solar supplied 15 percent or more of U.S. electricity needs on 102 days in 2021—up from just four days in 2019.
Last year’s coal boom narrative was clearly misplaced.
Add hydro to the mix, and the results are even more impressive. Combined, the three renewable resources were the largest electricity supplier in the U.S. on three days in 2021. This is a first for the sector but one that will occur with increasing frequency in the coming years as the renewable buildout gains speed.
Estimates vary, but there is unanimous agreement that tens of thousands of megawatts of utility-scale solar, wind and battery storage will be added to the U.S. electric grid in the next five years. IEEFA predicted last fall that wind and solar would account for 21 percent of demand by 2026. Given the positive 2021 results, that outlook now may be on the conservative side. Standard & Poor’s, for example, predicts that more than 100 GW of new utility-scale solar and 54 GW of wind could be installed in 2022 and 2023 alone, a record-shattering forecast that would quickly push wind and solar’s market share past 20 percent, and further undercut the tattered economics of the remaining coal-fired power plants.
In short, last year’s coal boom narrative was clearly misplaced. There was no boom, just a slight bump from the prior year’s historic lows, and the utility industry is signaling more clearly than ever that coal’s days of generating power are winding down.
Dennis Wamsted ([email protected]) is an IEEFA analyst/editor.
Seth Feaster ([email protected]) is an IEEFA energy data analyst.
Related items:
IEEFA. IEEFA U.S.: Surge of coal-fired generation retirements looking like a reverse S-curve


Related Content