Texas oil and gas employment may not rebound to pre-COVID levels
As good as it gets? Latest oil and gas industry data shows employment may have plateaued
Employment in the Texas oil and gas sector has rebounded since its September 2020 nadir, and industry leaders are touting the new jobs as an indication that the industry will continue to create jobs over the long term. However, a wider view of the landscape reveals that the oil and gas industry, at slightly more than one-fifth the pace of the statewide average, has been a laggard in Texas employment growth over the past 30 years.
It’s true that oil and gas businesses have added 39,400 jobs, but that’s only a little more than half the number lost during the COVID-19 pandemic. And those figures may be about as good as it gets in the wake of a May report indicating that the job additions may have already plateaued.
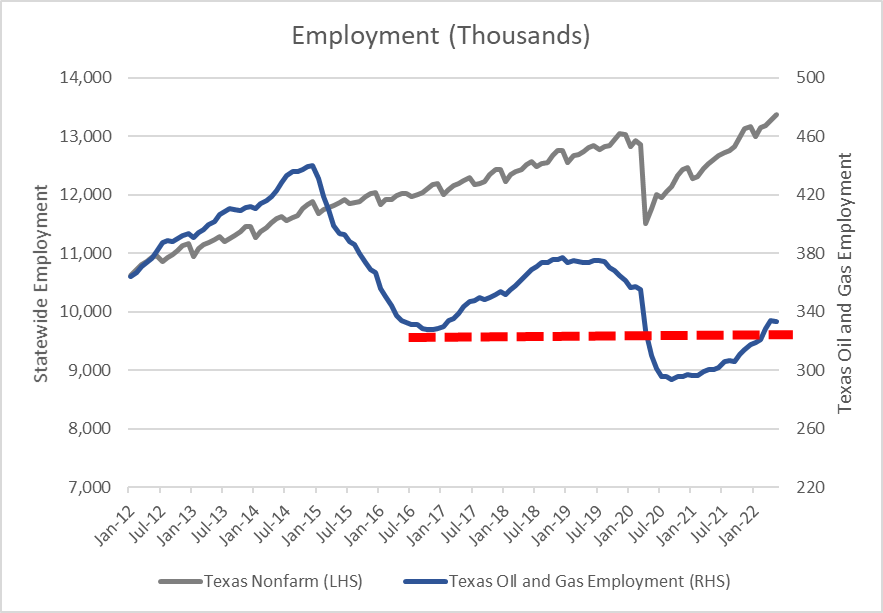
Figure 1: Texas Oil and Gas Employment Trending Opposite State’s Overall Pattern
Source: Bureau of Labor Statistics – Current Employment Statistics
Between September 2019 and September 2020, Texas employment for oil and gas extraction, support activities for mining, natural gas distribution, petroleum and coal products manufacturing, pipeline transportation, and gasoline stations industries (all key oil and gas industries) shed 21% of their collective workforce, or 76,300 jobs. If April 2022 employment of 333,900 jobs holds as the plateau for this latest cycle, then peak employment could wind up resembling previous oil and gas busts (see red dashed line in Figure 1).
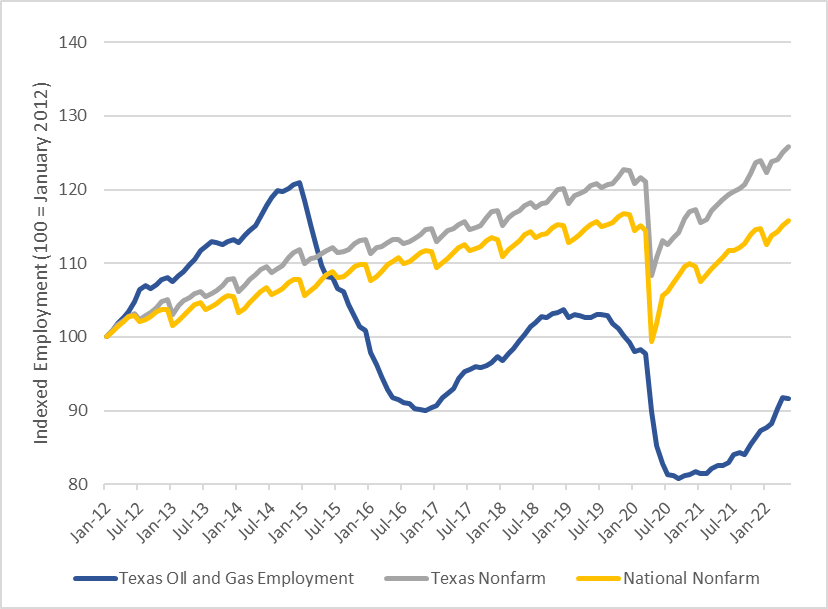
While the current environment presents some unique labor challenges, an identifiable long-term employment pattern also exists. In contrast to the overall employment picture—as represented by the Texas Nonfarm Employment, which has steadily risen over the past decade (with the exception of the COVID-19 slump) at a faster clip than the national figure—Texas oil and gas employment has declined over the last two boom-and-bust cycles for oil prices.
Figure 2: State and National Nonfarm Employment Vs. Texas Oil and Gas Employment
Source: Bureau of Labor Statistics – Current Employment Statistics
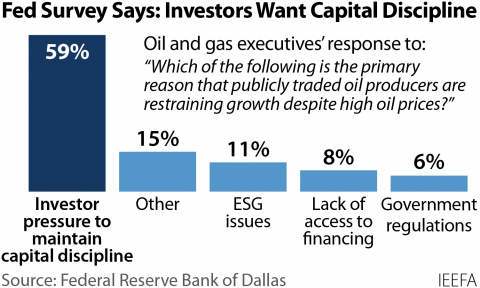
Industrial activities driven by the normal phases of resource extraction have changed since 2014. The industry has moved from the exploratory phase of the unconventional drilling of shale and tight oil formations to the development phase. Accompanying the development phase, oil and gas producers have been keenly focused on deploying technologies that drive down their unit costs for production volumes. Multiple wells drilled on a single pad (instead of just one well per pad) and innovations that include automation have combined to squeeze many days out of the drilling and completion process. The advances help explain how similar levels of production can be achieved with fewer rigs and fewer people in the field than a decade ago. The innovation also explains how the industry’s production continues to grow while size of the oil and gas workforce is moving in the opposite direction.
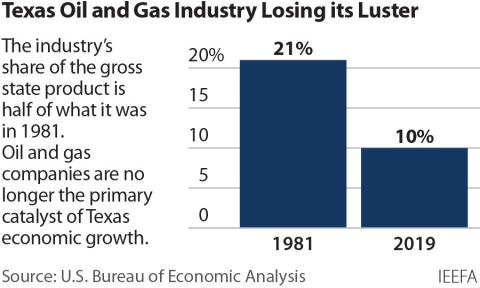
A further widening of the lens, however, reveals that the oil and gas industry is a laggard among all industries for Texas employment growth. From 1990 to the present, the total nonfarm employment payroll in Texas grew from 7.1 million jobs to 13.3 million jobs, an increase of 87 percent. Over the same three decades, employment levels for key oil and gas industries fluctuated with oil prices, from a low of 246,800 in 2003 to a record of 429,300 in 2014. Overall industry employment in 1990 was 272,600; most recently it was 330,400, up only 22 percent, or just slightly more than one-fifth the pace of overall Texas employment growth.
Over the last 32 years, key oil and gas industries in Texas have grown at an annual pace of 0.6 percent. More recently between 2020 and 2021—a time of recovery for the overall economy—the key oil and gas industries in Texas shed jobs by an average of 3.3 percent annually.
Similar observations were recorded in the recent U.S. Department of Energy’s U.S. Energy and Employment Jobs Report (USEER). The compendium reports on state and national employment trends by energy technology groups, which it breaks into five major categories: Electric power generation; motor vehicles; energy efficiency; transmission, distribution, and storage; and fuels. The fuels group offers some overlap with the key oil and gas industries we selected. The overlap consists primarily in two (natural gas, oil & other petroleum) of its seven sub-technology areas and accounts for 92% of the 265,273 fuel jobs found in Texas.
Of the 30,903 net annual employment additions in Texas reported in the 2022 Energy Employment by State USEER, about 13,000 were new jobs created in sustainable technologies like low or zero-carbon vehicles, energy efficiency, and solar. Table 1 highlights the year-over-year employment changes for the energy sectors. The fuels group was the only sector to lose jobs in 2021.
Table 1: Texas Energy Employment by Technology Group

Source: U.S. Department of Energy – Energy Employment by State 2022 USEER
The cognitive dissonance of some policymakers can be summed up as the belief that the oil and gas industry is a job-creating system. Texas, which is home to 11 percent of all U.S. energy jobs, did not create new oil and gas jobs last year—even though oil and gas prices were steadily improving throughout 2021.
A survey of employers within the fuels group suggests they embrace this dissonance, too, even though they reacted cautiously in their hiring practices last year. Fuels employers were the second-most optimistic group when polled on their hiring expectations over the next 12 months (NTM).
Table 2: Projected Employment Growth by Texas Employers

Source: U.S. Department of Energy – Energy Employment by State 2022 USEER
Over both the long and short term, it has become apparent that the Texas upstream fossil fuel industry is not supporting job growth. Figures parsed by both the Bureau of Labor Statistics and the Department of Energy lead to similar findings of unfavorable employment trends in the oil and gas sector. Instead, the Texas job growth is occurring in energy-efficient HVAC systems, electric cars, and solar.
With oil and gas employment in Texas clearly on a long-term downward trend, the industry is not the job creator that many have believed. Economic development planners and employment policy strategists in the state should take heed of this reality as they work to enhance Texas’s future.

