Seesawing gas market dominated by fear and volatility
Key Findings
Although most Australian LNG shipments are destined for Japan, China and South Korea, the impact of any strikes could see markets in Asia and Europe competing for LNG from alternative suppliers.
With lower European gas consumption this year, gas storage facilities have been filling up earlier, stopping prices from skyrocketing as they did in 2022.
LNG has evolved into a global commodity, which has had a significant effect on the price volatility that markets have experienced in recent years.
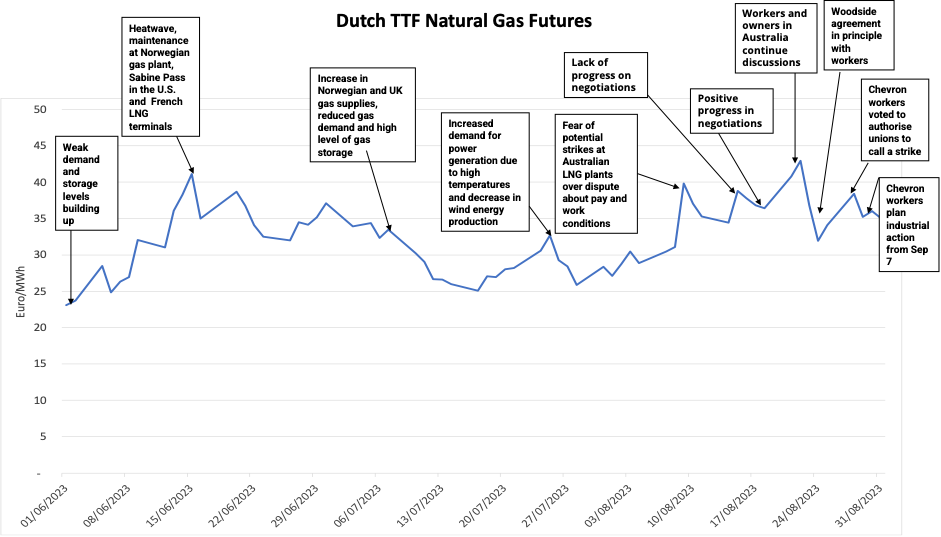
The fear of potential strikes by workers at three liquefied natural gas (LNG) plants in Australia has kept the European gas market vigilant for any progress in negotiations that could significantly affect global gas supply and, consequently, the price of futures contracts for physical delivery at the Netherlands’ Title Transfer Facility (TTF). The European gas market has witnessed significant volatility in recent weeks. With the uncertainty on how the situation in Australia will unfold, Europe should brace for more volatility and an increase in prices.
The LNG facilities that could be affected by the strikes are North West Shelf (operated by Woodside Energy), Gorgon and Wheatstone (both operated by Chevron). Together, they represent around 10% of global LNG exports. Australia is a big player in the LNG global market. Qatar, Australia and the U.S. together account for almost 60% of global LNG supply. Even though the majority of Australian LNG exports are destined for Japan, China and South Korea, disruption from the strikes will see Asia and Europe competing for LNG from other suppliers.
After the record TTF price of €340 per megawatt-hour (MWh) in August 2022, prices fell to about €23.11/MWh by early June 2023. The decline was mainly caused by European gas demand dropping in the first half of 2023 by more than 10%, or more than 30 billion cubic metres (bcm). The drop was affected mainly by high gas prices, low industrial demand, gas-saving mechanisms, an increase in heat pump installations, a decrease in gas to power production and a rise in renewable generation.
But amid decreasing gas consumption, European gas markets have witnessed constant price fluctuation over the last three months, due to the weather, maintenance at gas plants and most recently the risk of potential strikes in Australia. The fear of an unbalanced gas supply and demand seesaw has dominated markets.
Source: ICE, Bloomberg, investing.com, IEEFA
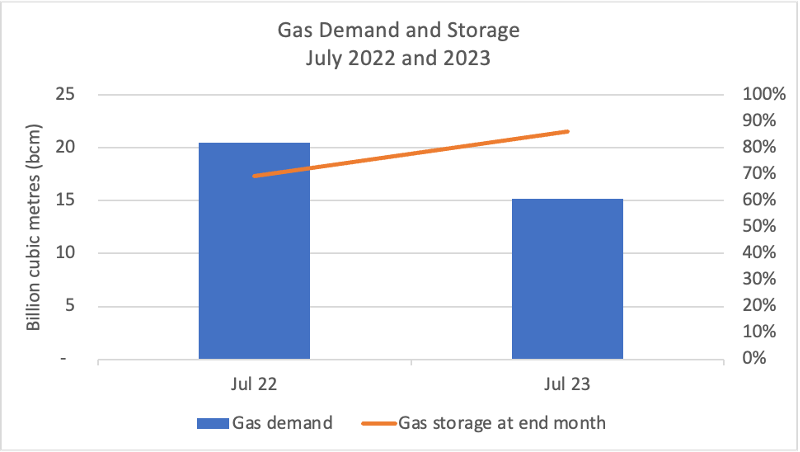
Still, there’s a considerable difference between the peak TTF price of €340/MWh in August 2022 and the peak of €43/MWh in August 2023. These two months started with different conditions in their respective years. The European Union’s gas demand in July 2022 was 20.5 bcm, 26% higher than it was in July 2023 (15.1 bcm); conversely, gas storage at the end of July 2022 was only 69% full, compared with 86% in July 2023. Since gas consumption has been lower during 2023, gas storage facilities have been filling up earlier, which has so far stopped gas prices from skyrocketing to 2022 levels.
 Source: Eurostat, Gas Infrastructure Europe, IEEFA
Pricing behaviour: Is gas the new oil?
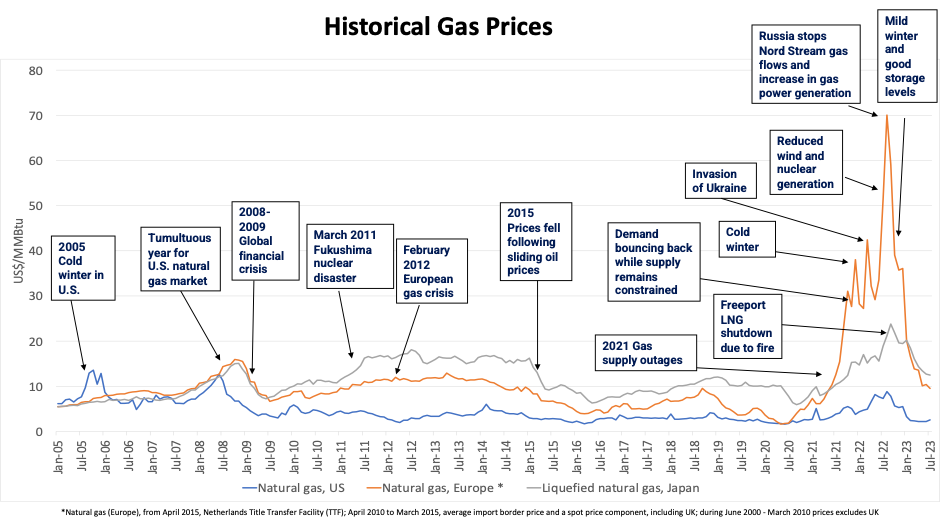
Historically, a variety of events have affected gas supply and demand, and they have consequently influenced the volatility of gas prices globally. Such events include security issues at export facilities, economic crises, natural disasters, extreme weather, changes in oil prices, reduction in supply, changes in renewable generation and storage levels.
Source: World Bank Commodity Price Data (The Pink Sheet), IEEFA
LNG prices are determined by buyers and sellers, depending on where the fuel is purchased. Natural gas is traded globally in both pipelines and as LNG, on a spot and long-term basis.
Natural gas started trading mainly regionally via pipelines, but the gas has been evolving into a global commodity with the increase in LNG trades. This evolution has had a significant effect on the price volatility that gas and LNG markets have been experiencing in recent years.
Initially, natural gas was sold in long-term sales and purchase agreements with take-or-pay clauses, and indexed to crude oil and oil products. With the increase in global LNG trades, new producers and consumers entered into the market and new forms of contracts and pricing mechanisms were used.
There are various ways in which natural gas can be traded and priced. Over the past decade, there has been a shift from European prices based on oil indexation to market-based pricing through greater competition between gas sources. Prices, especially in northwest Europe, continue to be driven by gas supply-and-demand dynamics and are actively traded on gas hubs. In the last few years, the TTF has become the largest and most liquid of these hubs by a significant margin. Trading can occur on exchanges or over the counter. Exchanges are generally more easily accessible to all market participants and provide transparency.
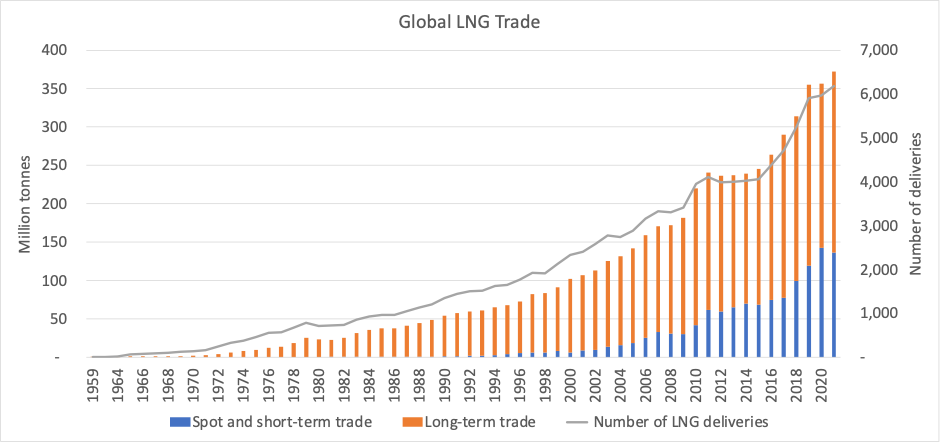
World gas consumption grew steadily from 630 bcm in 1965 to 4,038 bcm in 2021, while Europe’s gas demand peaked in 2005 (628 bcm) and has been declining since then. The rise in global gas demand has also influenced the growth in LNG trade, which increased 11% per year from 2.6 million tonnes (Mt) in 1971 to 372.3 Mt in 2021, when LNG was delivered to 44 different markets around the world. The share of spot and short-term LNG trade increased from just 5% in 2000 to 40% in 2020 and 36.6% in 2021.
Source: The International Group of Liquefied Natural Gas Importers
The sharp rise in the gas demand that the world has experienced in the last 50 years and the surge in LNG traded globally and in spot and short-term sales have had a significant impact on the behaviour of gas prices.
Gas markets are becoming riskier—gas and LNG prices are increasingly volatile and greatly affected by global factors. The uncertainty of future events that could affect gas supply makes it extremely difficult to predict how the supply and demand could be balanced and how much prices could escalate by. As seen in last year’s events in Europe, the only way that importing countries can mitigate that risk is by reducing their internal consumption.


