The heat of the moment: India’s shifting patterns of power use

Key Findings
The minimum temperature explained 88% of Delhi’s daily energy use variation, while the maximum only managed 60%. It also better explained peak demand (67% vs 60%).
Peak electricity demand is now far more likely to occur in the early afternoon than in the evening, with a major change occurring in just the last three years.
Transmission capacity still limits the ability to move renewable power regions where there is demand.
Even as rains have given some relief from the recent relentless and widespread heat, electricity generation and consumption have already reached record highs in India.
Quite reasonably, the focus of most conversations is on India’s success in maintaining adequate power plant coal stocks and averting a major power crisis, despite blackouts like the ones afflicting Lucknow in recent days. Also entering the mainstream conversation is the paradox that growth in air conditioning provides relief to some while exacerbating global warming for all through its effects on energy use.
But behind these stories lie some intriguing and important trends in patterns of electricity use that have a bearing on how India manages the heat.
India’s grid controller, Grid India, undertakes significant research and planning to stay one step ahead of rising demand. In 2016, its ‘Electricity Demand Pattern Analysis’ summarised various daily, seasonal and regional patterns. Illustrating temperature effects, the report showed how Delhi’s 2014-2016 peak demand rose by over 100 megawatts (MW) for each extra degree in maximum temperature in the hot months (as air conditioners and fans are switched on). On the other hand, the report found that peak demand rose by less than half that amount with each degree drop in the winter months (attributed to space heating).
Our analysis of Grid India’s daily power generation and distribution data, along with weather statistics, suggests that updating this report could help the power sector keep pace with some evolving trends.
Despite Grid India’s use of daily maxima, how high the daily minimum temperature is, explains electricity consumption better than the daily maximum. Taking each day’s power and weather data for Delhi between 1 January 2022 and last week, Figure 1 plots power consumption against that day’s minimum (blue) and maximum (red) temperature. How well each explains power consumption can be indexed with a statistical measure (R2), which we express here as a percentage. Here, 0% would show no relationship between temperature and power consumption, and 100% would indicate temperature fully accounting for electricity usage.
Figure 1: Temperature effects on Delhi's daily power consumption.
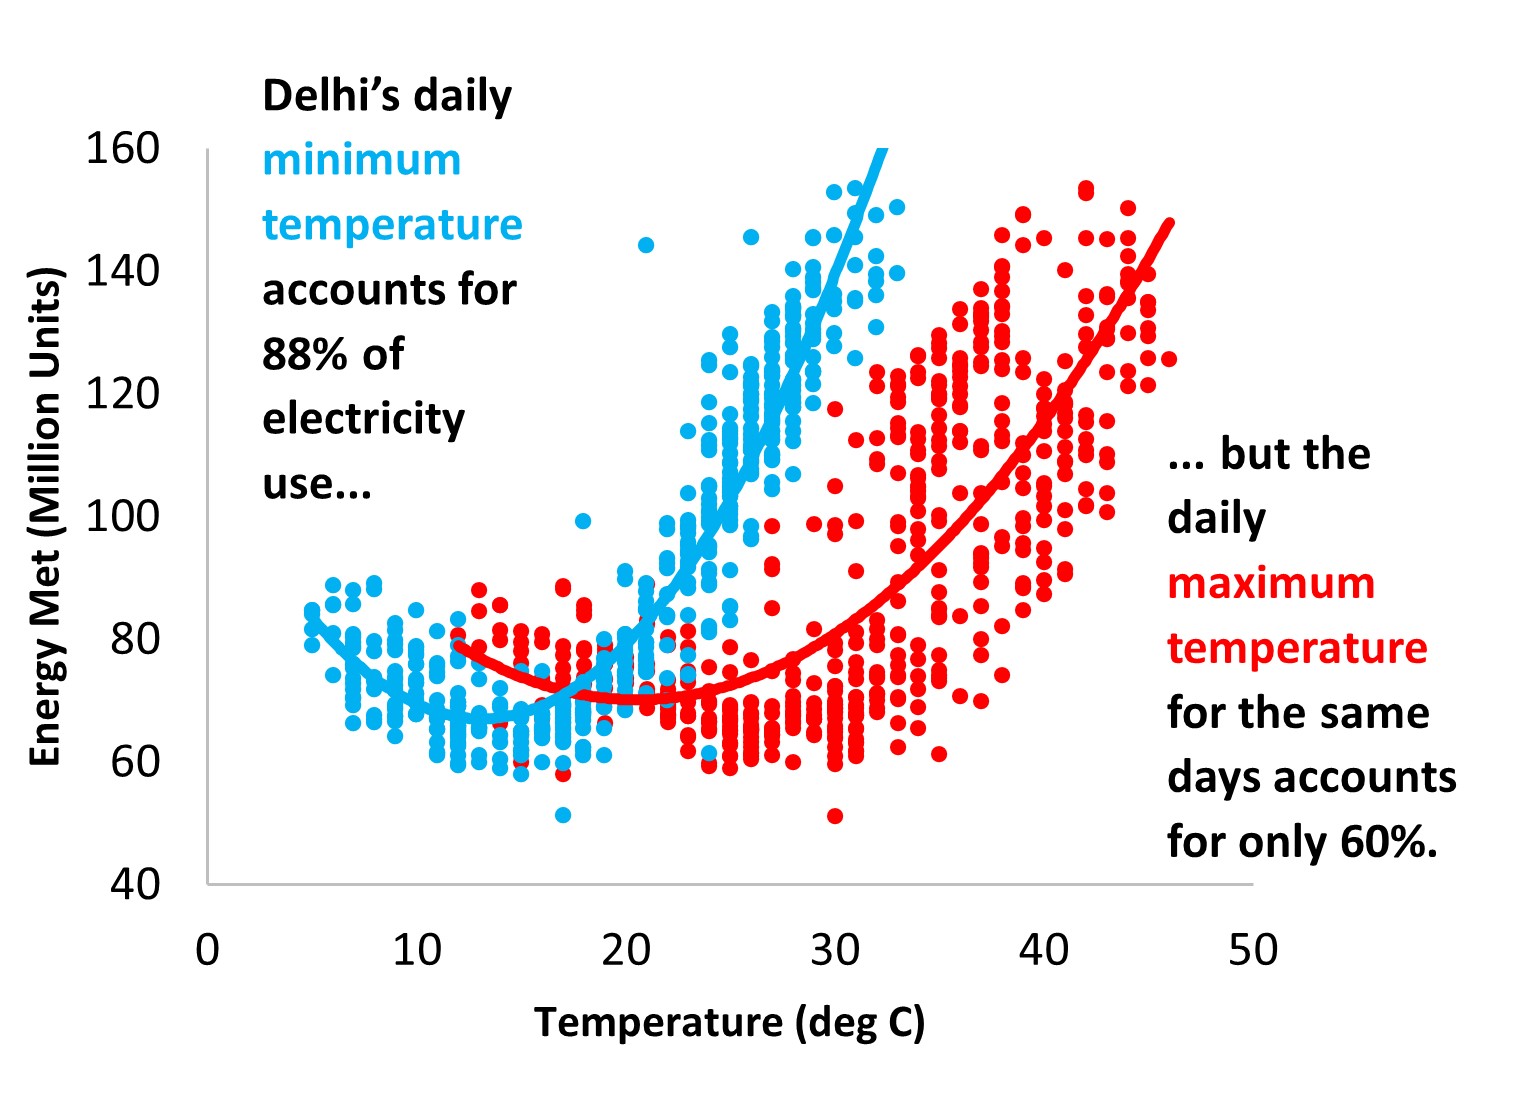
Source: Author’s analysis of daily Grid-India electricity and Accuweather temperature data between 1 January 2022 and 25 May 2023.
The minimum temperature explained 88% of Delhi’s daily energy use variation, while the maximum only managed 60%. It also better explained peak demand (67% vs 60%). Further, the findings extended to the entire Northern Region, which encompasses seven states and three Union Territories from Jammu and Kashmir to Uttar Pradesh and is home to nearly one-third of India’s population.
Delhi’s 2022 daily maximum temperatures accounted for 36% and 51% of the variation in the Northern Region’s peak demand and energy consumption, respectively, but its daily minimum explained 72% and 81% of those same values.
Why might power consumption more closely track minimum than maximum temperatures? Along with the fact that nights are warming faster than days, one possibility is that many people are at work or outside during the daytime when temperatures reach the maximum. Thus, people cannot use their home cooling appliances. Conversely, exceptionally hot evenings and nights reduce comfort, disrupt sleep at home and are having serious health effects. They serve as the trigger for switching on the AC if the household can afford one.
Whatever the explanation, confirming this relationship as part of an updated and more comprehensive Electricity Demand Pattern Analysis could allow Grid India to make more precise day-ahead generation and transmission scheduling.
Another contrasting observation is that peak electricity demand is now far more likely to occur in the early afternoon than in the evening, with a major change occurring in just the last three years.
Why has the peak moved to the afternoon? Again, explanations are somewhat speculative, but one contender is the major shift to working from home because of COVID-19. Indeed, the U.S. National Bureau of Economic Research surveyed over 37,000 workers in 27 countries in mid-2021 and early 2022 for its Working from Home Around the World study. Indian respondents reported more fully-paid home-working days per week than any other country (2.6 vs the average of 1.5) and expected their employers to continue those arrangements in the future. Working from home would increase the domestic component of daily electrical load, which has typically peaked in the daytime, and promotes electricity use for appliances other than just cooling.
As pointed out by the Institute for Energy Economics and Financial Analysis’ Purva Jain and the Vasudha Foundation’s Raghav Pachouri and colleagues, this shift means that peak demand increasingly coincides with the availability of grid-connected solar power. The current analysis shows the extent of the change quantitatively and its relationship to the hot pre-monsoon period.
The yellow wedge in each circle in Figure 2 represents the proportion of days in the year when peak demand fell in daylight hours (defined here as between 7:30am and 6pm). We show the data from 2019 and 2022 for each of India’s five electricity regions, along with All India values.
Figure 2: Proportion of days in year (yellow wedge) when peak demand occurred between 7:30 am and 6 pm
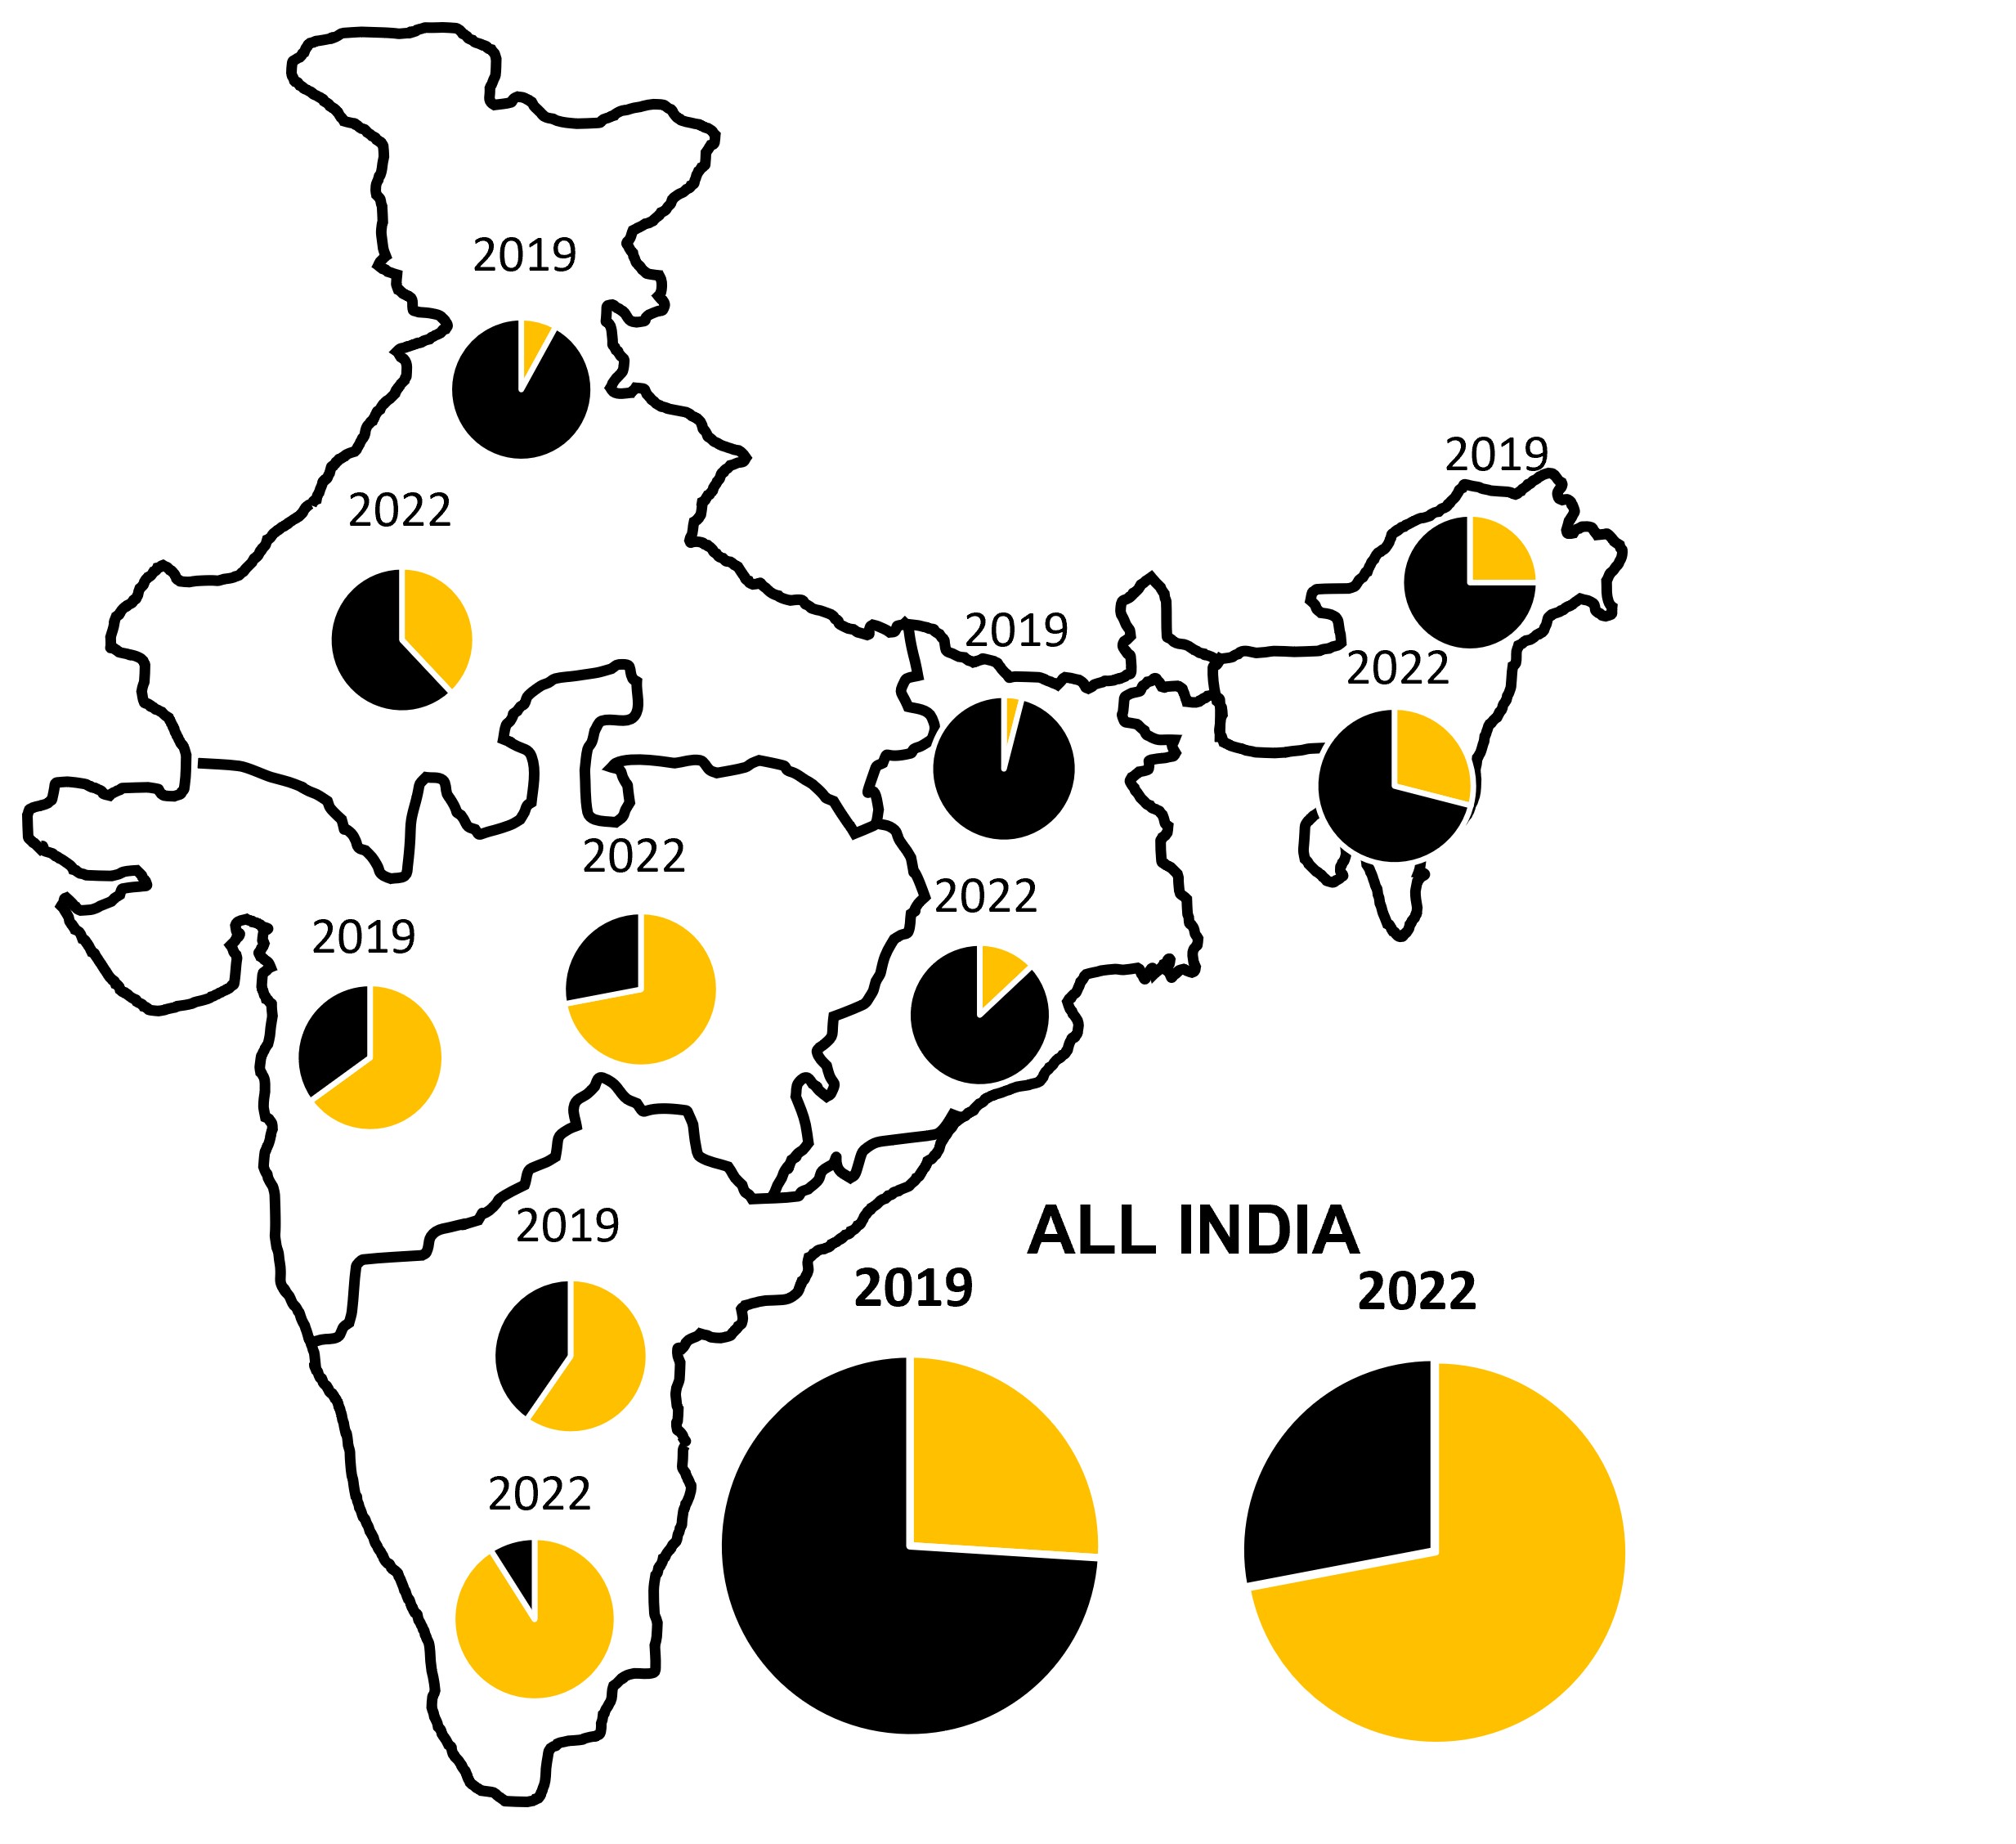 Source: Author’s analysis of Grid-India data.
Every region has experienced an increase in the proportion of days when peak demand moved from evening to daytime hours. The Western and Southern Regions already had a majority of such days in 2019, but growth in the Northern Region, from a low base, is significant as it is a major load state in the hottest months.
At the national level, peak demand now occurs in the daytime nearly three-quarters of the time, and that proportion nearly tripled in three years.
This shift underlines the opportunity for India to capitalise on much increased solar generation not only to meet general emissions goals but to help beat the heat without excessive reliance on coal. This is especially important for April and May before the monsoon boosts wind and hydro generation, displacing a substantial part of thermal power.
The shift to the daytime peak has been even more dramatic in those months, rising from just 15% in 2019 to 92% in 2022. So far in 2023, despite exceptional heat and power demand, this increase is more or less holding (78% from 1 April to 25 May).
Finally, while India generated 17% more power in 2022-23 than in 2018-19, it transmitted 30% more electricity between regions, a component that makes up about 15% of power generated. In addition, the four hot months of May to August see the power-hungry Northern Region's largest imports of the year. Growing transmission capacity is another key ingredient for ensuring sufficient electricity to keep the nation cool.
Transmission capacity still limits the ability to move renewable power regions where there is demand. Some of the transmission lines reflect plans laid before renewable energy took off. A classic example is the 1,765km long, 800 kilovolts (kV) Pugalur-Raigarh HVDC line, intended and designed principally to move thermal power from the coal regions to the south. It has a 6,000MW capacity for southward transmission but a 3,000MW cap in the opposite direction. Unsurprisingly, the Central Electricity Authority is now seeking to ease this constraint and enable far more South Indian clean power to support the load in regions to the north, especially in mid-and late summer.
Heatwaves will continue to strike India, and those without access to cooling will bear the brunt. Access to cooling enabled by electricity accelerates demand, and many measures are needed to keep that demand manageable. In addition to the rapid acceleration of solar generation and expansion of inter-regional transmission capacity, there is a need for widespread adoption of the Energy Conservation Building Code 2017 to reduce the need for cooling and make it more efficient when used. But because planning and research are the essential precursors of a more effective policy, a thorough updating of the Electricity Demand Pattern Analysis report to better understand temperature effects and the time of peak load could play an important part in keeping India cool.
This article was first published by Financial Express.

Related Content