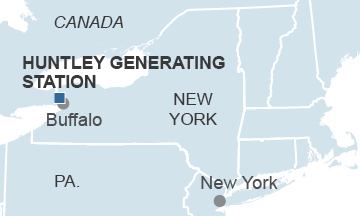
 Our 2014 report on the failing financial health of the Huntley Generation Station in Tonawanda, N.Y., highlighted the fact that regional grid operators were relying less and less on the plant for electricity.
Huntley’s capacity factor—the ratio of how much power it produced versus how much it was capable of producing—had been declining for five years. Our report emphasized how power prices in western New York (and nationally) were declining, driven down by abundant and low-priced natural gas (Huntley was a coal-fired plant), a trend that wasn’t helping Huntley. We noted also that electricity prices in western New York are kept relatively low by an abundance of hydroelectric power. By late 2015, NRG, the owner of Huntley, and the New York ISO, which manages the power grid, had conceded the inevitable—that the plant would close.
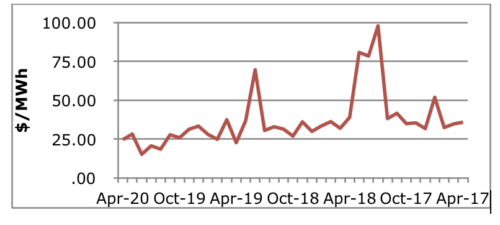
Some who have since questioned Huntley’s closing have suggested the move will raise electricity rates. The fact is, the plant’s retirement does not appear to be raising retail electric rates in western New York, and a review of real-time power prices in western New York shows them declining and suggests they will remain low for as long as natural gas prices remain low.
Questions about the impact of Huntley’s retirement stem probably from temporary price fluctuations at a few of the dozens of hubs in the western New York electricity grid, but prices from a few points do not give an accurate representation of the average wholesale price of electricity in the region. The chart below shows no appreciable increase in the wholesale price of power since the closure of the plant in February. Prices were low then and remain low today.
NYISO Real-time Power Prices for Western NY
The retail price of power in western New York is based on the average cost of withdrawing power from many points on the western New York grid. For example, Niagara Mohawk, which publishes on its website a monthly Electric Supply Costs report shows no increase in these costs since the closing of the Huntley plant. Indeed, these costs are lower than they were during the same period of 2015, when the Huntley plant was operating.
The Huntley Plant before its retirement was losing its significance as a source of power for western New York for several years simply because the plant could no longer compete.
We believed at the time of its closing that shutdown would have no impact on prices. The data today bears out our assertion.
Table: Niagara Mohawk Electric Supply Costs
March-May 2016 versus March-May 2015 (cents/kWh)
| 2016 | 2015 | |
| May | 4.117 | 4.275 |
| April | 2.824 | 3.521 |
| March | 2.712 | 5.643 |
SEPARATELY, SOME HAVE SUGGESTED THAT THE REGIONAL GRID OPERATOR HAS HAD TO TURN TO OTHER, DIRTIER COAL-FIRED POWER PLANTS to replace power Huntley had been providing.
We turn again to the facts.
The predominant electricity-generation supply for the area is hydroelectric power. Almost 70 percent of western New York’s generation capacity comes from hydro. The remainder is supplied by a combination of coal, oil, natural gas and renewables.
Further, peak summer demand totals 2,764 megawatt hours, and the existing system can supply 3,994 megawatt hours. In other words, there’s more than enough capacity to meet summer demand in the region and—to the Huntley point—what power Huntley was supplying can now be supplied by hydroelectric generation.
We’ve examined how much coal-fired power has been moved into western New York over the past several years and whether it correlates to the ups and downs in Huntley plant use. If—as some have argued—the closure of the plant precipitated a rise in the amount of coal-fired electricity shipped into western New York, that would have been apparent over the past several years, when Huntley’s utilization decreased. But there is no correlation between reliance on coal-fired electricity from PJM—the electricity grid that serves 13 states—and whatever was happening at Huntley.
We note also that the amount of PJM coal-fired generation imported into western New York seems have declined over the past three years. And we see a general decline in the amount of electricity shipped from PJM into western New York in the first quarter of 2016 (the period during which the Huntley plant closed) and the same period last year.
Comparison of Huntley Capacity Factors with the flow of PJM Coal Power into Western New York
| Huntley Capacity Factors | |||
| Month | 2015-16 | 2014-15 | 2013-14 |
| February | 50.99 | 35.14 | 74.87 |
| January | 42.76 | 28.76 | 72.29 |
| December | 10.08 | 5.13 | 34.84 |
| November | 2.88 | 0.10 | 25.88 |
| October | 0.00 | 19.22 | 20.78 |
| September | 5.08 | 27.90 | 5.59 |
| August | 6.12 | 30.97 | 15.81 |
| July | 11.71 | 45.54 | 53.07 |
| June | 14.45 | 59.20 | 36.12 |
| May | 11.71 | 27.64 | 6.99 |
| April | 0.00 | 34.04 | 37.91 |
| March | 15.12 | 40.11 | 48.35 |
| PJM Coal Generation (GWh) | |||
| Month | 2015-16 | 2014-15 | 2013-14 |
| February | 21,938 | 33,31> | 34,845 |
| January | 25,361 | 32,666 | 37,883 |
| December | 16,883 | 27,966 | 32,681 |
| November | 17,816 | 27,219 | 27,073 |
| October | 18,003 | 23,145 | 26,597 |
| September | 24,461 | 25,255< | 29,173 |
| August | 26,910 | 29,776 | 31,620 |
| July | 27,534 | 31,489 | 34,879 |
| June | 24,259 | 29,969 | 30,772 |
| May | 21,619 | 24,165 | 25,825 |
| April | 18,265 | 25,940 | 24,637 |
| March | 25,902 | 34,351 | 29,680 |
Tom Sanzillo is IEEFA’s director of finance.
Related posts:
Opportunity Knocks With Closing of Coal-Fired Power Plant in Upstate New York
New York Is on the Verge of Going Coal Free
How to Invest in Struggling Coal-Industry Communities? Let Us Count the Ways

