EU Gas Flows Tracker
Last updated: May 2026
About
IEEFA’s EU Gas Flows Tracker is an interactive data tool to visualise Europe’s gas pipeline flows. It is built by compiling data from Eurostat, the EU Joint Research Centre’s security of gas supply dashboard and IEEFA analysis.
Note: Using an updated internet browser will help to ensure all graphics on this page display correctly. Some elements might not appear properly on all mobile devices. For any issues, contact us.
Key Findings
Data policy
This page provides data from publicly available datasets provided on the EU security of gas supply dashboard of the Joint Research Centre (JRC) of the European Commission. The JRC states that the “data published in the dashboard is sourced exclusively from public information.” Any use (including distribution or publication) of the data should properly attribute the source, “Eurostat, JRC EU security of supply dashboard, IEEFA analysis,” but not in any way that suggests that IEEFA endorses the user their use of the data.
As Europe’s efforts to reduce gas consumption falter, energy security is under threat. The 2026 energy crisis shows that as long as EU countries choose to rely on gas, they must accept the geopolitical risks that this dependency entails.
Following Russia’s full-scale invasion of Ukraine in 2022, the EU cut gas consumption and diversified energy sources to boost security of supply. Between 2021 and 2023, EU gas consumption decreased by 20%. But in the following two years, efforts to reduce gas demand stalled.
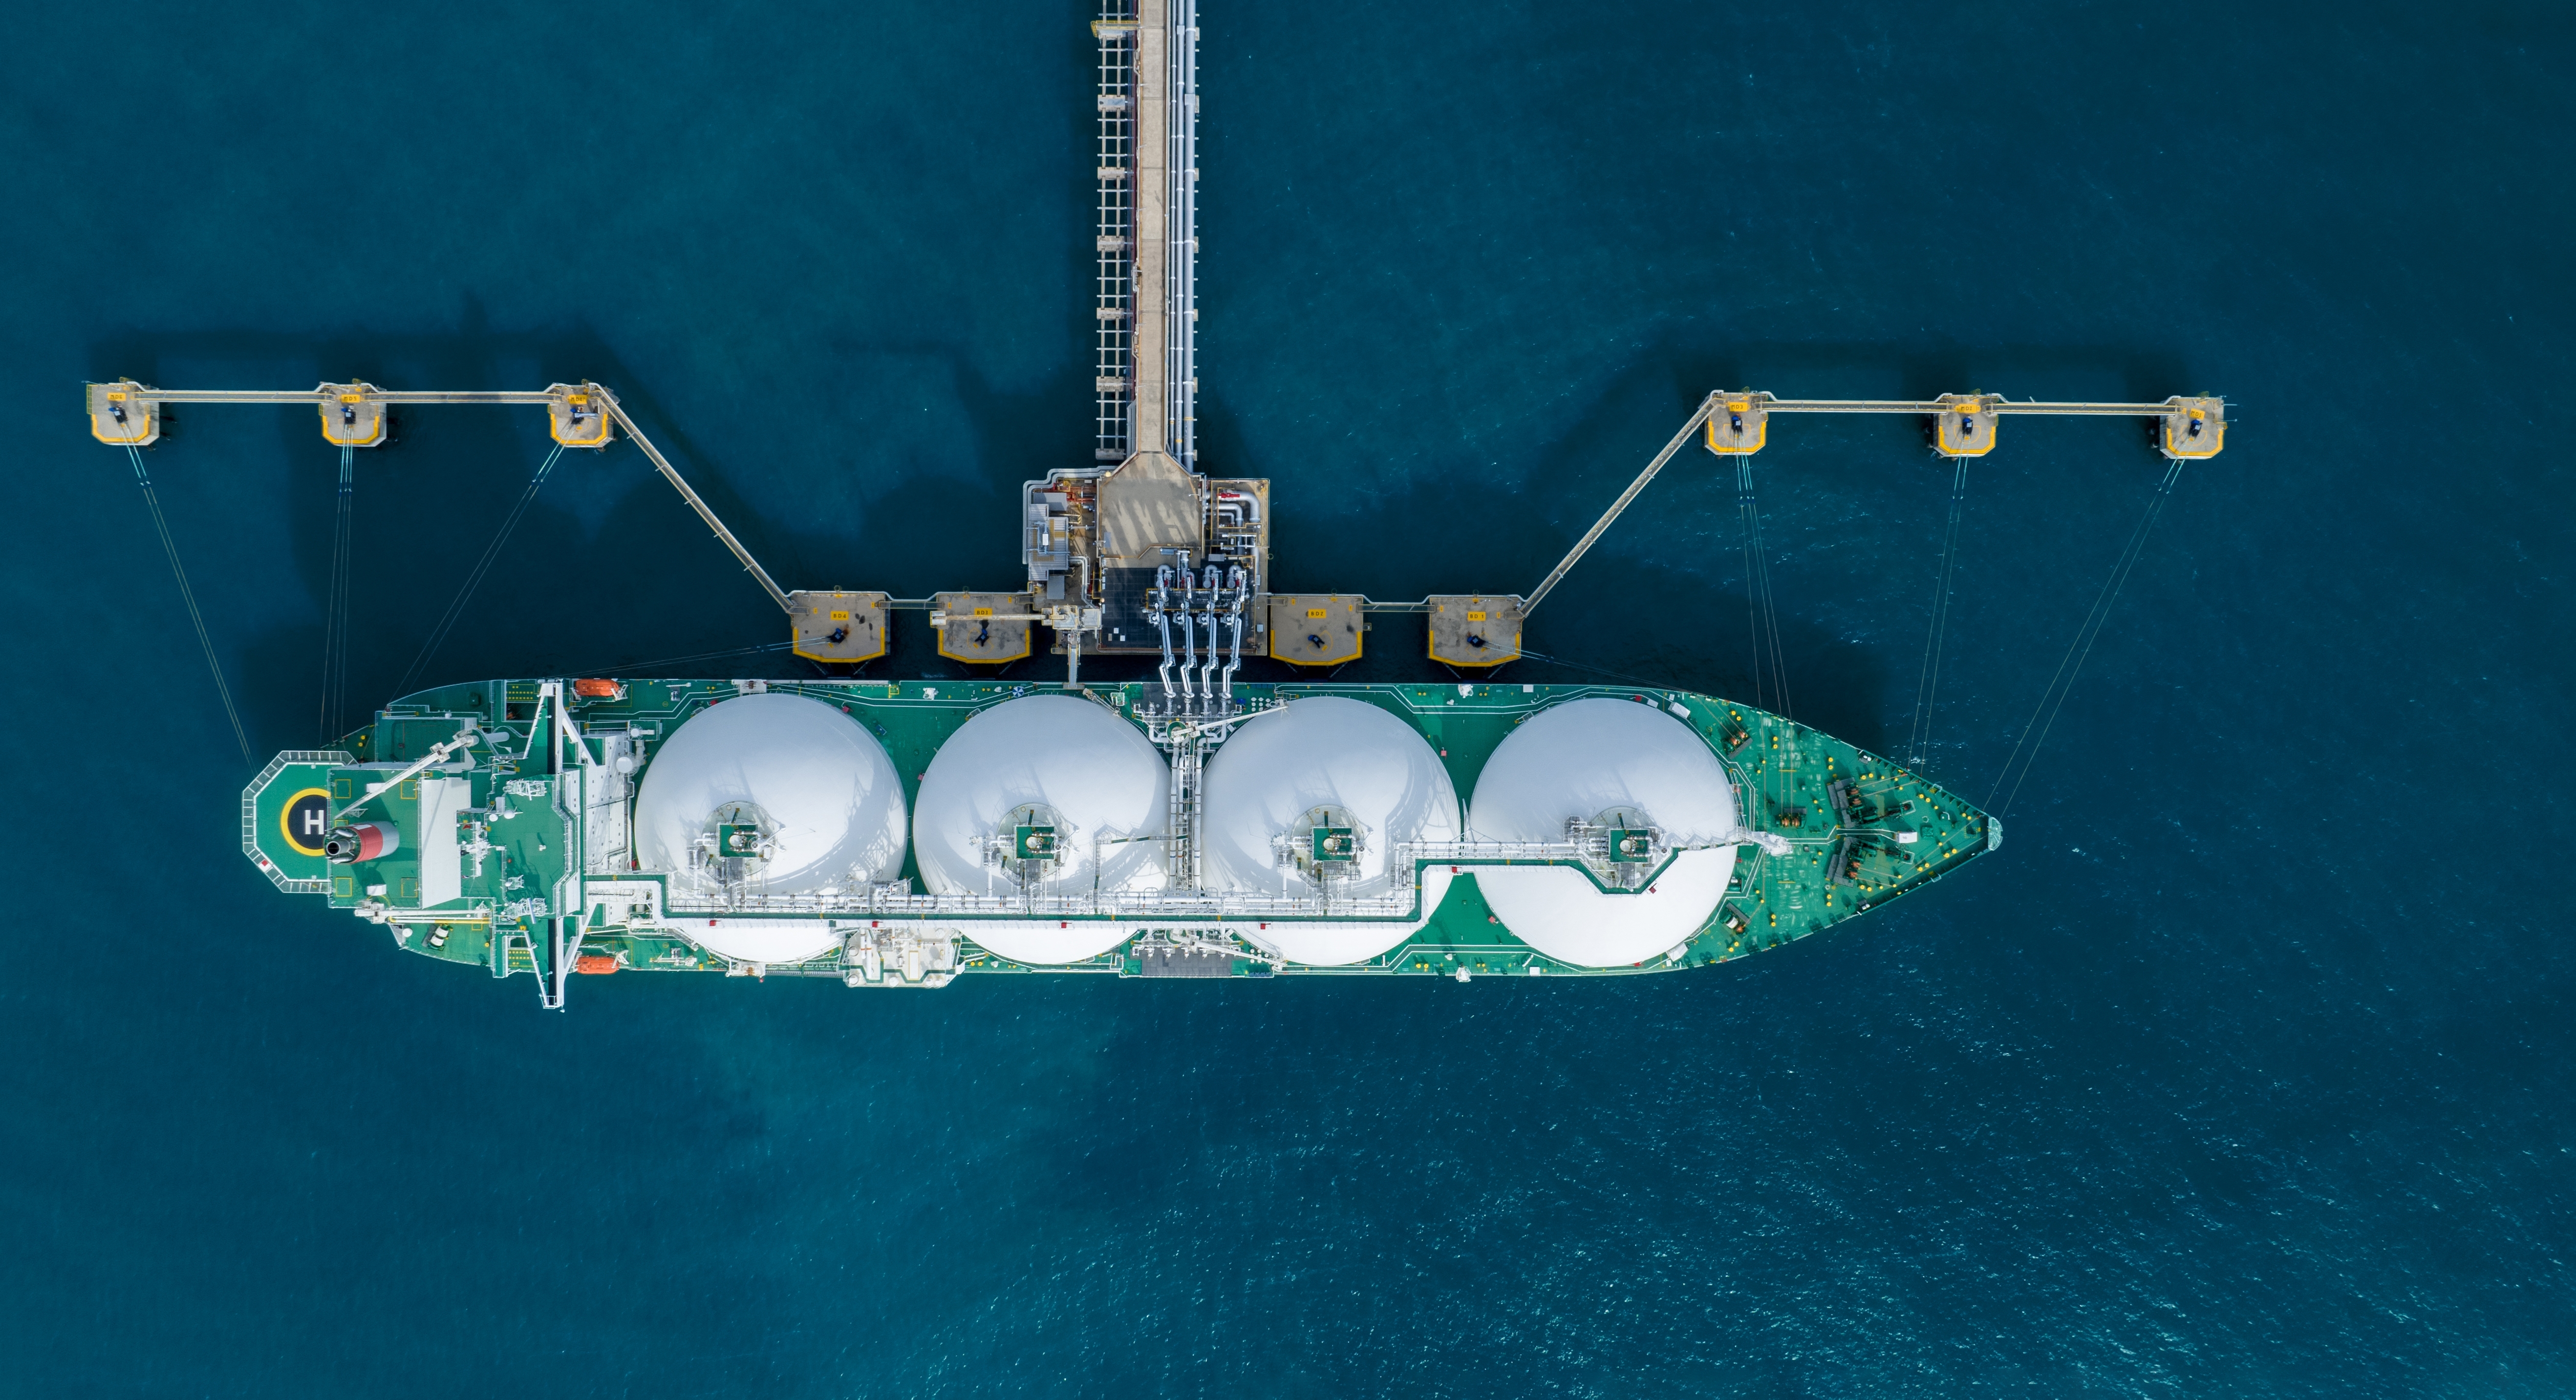
In 2026, the world is facing another energy crisis, which has disrupted 20% of global liquefied natural gas (LNG) supply and increased gas price volatility.
By shifting from Russian pipeline gas to LNG, the EU has swapped one geopolitical vulnerability for another. The EU must instead continue reducing gas consumption by replacing gas with renewables and strengthening energy efficiency measures.
EU misses gas demand reduction targets
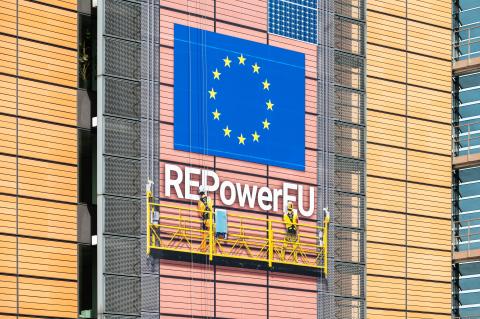
EU gas consumption in 2025 was 5% higher than the target for that year in Fit for 55, the EU package that aims to reduce the bloc’s greenhouse gas emissions by at least 55% by 2030. Gas consumption was also 9% higher than the 2025 target in REPowerEU, the EU’s strategy to reduce its dependency on Russian fossil fuels.
REPowerEU targets a 44% decline in EU gas demand between 2025 and 2030. Fit for 55 targets an 18% fall over the same period.
Pipeline imports reverse downward trend in Q1 2026
Between 2021 and 2025, the EU reduced pipeline gas imports by 41%, while LNG imports rose.
Total EU gas imports increased by 5% in 2025, with a rise in LNG imports partly offset by a 9% fall in pipeline imports. This decline was driven by the end of Russian gas transit via Ukraine on 1 January 2025.
In the first quarter (Q1) of 2026, total EU gas imports increased by 10% year on year, as LNG and pipeline imports rose by 13% and 8% respectively.
Norway dominates pipeline supply
Norway is the EU’s largest source of pipeline gas, supplying 54% of the bloc’s pipeline gas imports in 2025 and 55% in Q1 2026. EU imports of Norwegian pipeline gas were flat in 2025.
Algeria is the EU’s second-largest pipeline gas supplier, representing 18% of EU pipeline imports in 2025 and 20% in Q1 2026.
Russian gas transit via Türkiye is the EU’s third-largest source of pipeline gas, accounting for 11% of the bloc’s pipeline imports in 2025 and 12% in Q1 2026. EU imports of Russian pipeline gas via Türkiye increased by 8% in 2025 and continued rising in Q1 2026.
Lithuania's gas transmission system operator signed a new five-year deal in December 2025 for the transit of Russian gas through Lithuania to Russia’s Kaliningrad exclave.
EU imports of UK pipeline gas rose by 11% in 2025.
US on track to be EU's largest gas supplier
Combining pipeline gas and LNG, Norway is the EU’s largest gas supplier, followed very closely by the US.
Norway has supplied about 30% of the EU’s total gas imports in recent years.
US LNG shipments to the EU almost quadrupled between 2021 and 2025. The US accounted for 29% of total EU gas imports in Q1 2026, up from 25% a year earlier.
Given the disruptions to Qatari LNG exports because of the ongoing Middle East crisis, IEEFA forecasts that the US will surpass Norway as the EU’s main gas supplier in 2026.
Russia is the EU’s third-largest gas supplier, representing 15% of the import mix in Q1 2026, followed by Algeria with 12%.
Spending on pipeline gas imports
Of the approximately €404 billion that EU countries spent on pipeline gas imports between 2022 and 2025, about €177 billion was for Norwegian gas and €80 billion for Russian gas — the two largest suppliers over this period.
EU countries spent €5.9 billion on Russian pipeline gas in 2025.
Authored and compiled by:


With contributions from Aniket Narawad, Communications Consultant, Europe.