IEEFA U.S.: The gathering solar wave

Announcing last week that it would create the largest regulated utility-scale solar footprint in the world, Florida Power & Light signaled its intentions to nudge the Sunshine State away from its ironically dubious reputation as a renewable-energy laggard.
The initiative will add 30 million solar panels, five times the state’s current solar capacity, easing its longtime dependence on gas- and coal-fired power. The utility provides electricity to about half of Florida’s 21 million residents, and its utility-scale push is good news for the larger economy, as it will create construction jobs that could mark the beginning of a statewide solar-manufacturing industry.
Data compiled by the Energy Information Administration (EIA) shows that the state—which has raw solar-power potential nearly on par with the sunniest region of the U.S., an area that runs from Southern California through southern Arizona and New Mexico into southwest Texas—was stuck in its fossil-fuel rut from 2001 to 2017 even as other states began to embrace renewable generation.
The New York Times last month published an interactive state-by-state breakdown of electricity-generation trends based on EIA data that showed Florida in 2001 got about one-third of its power from coal, another quarter from natural gas, and the rest from a combination of oil and nuclear generation. By 2017, 67% came from natural gas—the result of the fracking boom—while coal’s share of the market had dropped to 16% and nuclear power accounted for most of the rest. Renewable generation remained a negligible piece of the mix.
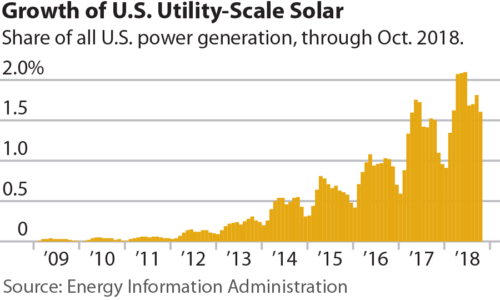 CLEARLY, A SOLAR WAVE IS GATHERING MOMENTUM NATIONALLY, AS UTILITIES ACROSS THE COUNTRY openly—and often for the first time—incorporate or expand utility-scale programs in their development plans that guide investments in power generation and distribution.
Continuing this trend, California, as part of a push to go all renewable, increased the solar portion of its electricity generation to 16% by 2017 from next to nothing five years earlier. Hawaii, historically addicted to expensive oil imports, in just three years tapped solar for 11% of its energy in a renewables program similar to California’s. With its recent announcement of multiple low-cost contracts for solar plus storage, Hawaii appears to be well on track to meeting its goal of 100% renewables by 2045.
Other states that have shown rapid uptake include Arizona (6%) and Massachusetts (7%), examples of how U.S. solar markets are developing across the geographic and policy spectrum. Some of the changes stem from public-private initiatives, such as the 413MW partnership between Google and the Tennessee Valley Authority on projects in Alabama and Tennessee. The EIA has identified North Carolina—along with California and Texas—as having one of the largest solar-growth markets in the U.S.
Soaring near- and long-term forecasts.
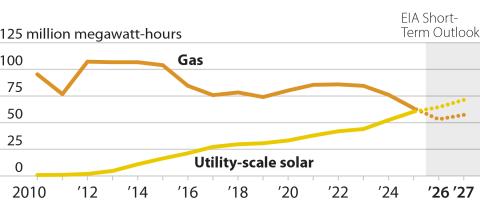
In a 2019 outlook published this month, the EIA estimates that 24 gigawatts (GW) of new generation capacity will come online this year, 46% from wind and 18% from solar. While it is worth noting that the EIA has an uneven record on coal-generation forecasts, it has been much closer to the mark in predicting how renewable energy markets will develop.
Something similar to what is happening state-by-state across wind power markets appears to be developing now in solar. Wind has gone mainstream—even dominant— in several states, including seven that get double-digit percentages of their electricity from wind: Iowa and Kansas (37%), Oklahoma (32%), South Dakota (27%), Minnesota (19%), Colorado (17%), Texas (15%), Nebraska and New Mexico (14%).
Change is taking root in the heart of traditional fossil-fuel bastions where energy sensibilities are sometimes erroneously stereotyped as “anti-renewable,” as long as market forces are allowed to run their course—unlike in areas where status-quo forces have kept the transition to renewables at bay.
Examples of the latter include Ohio, still 80% reliant on fossil-fuel-fired generation, and West Virginia, which continues to get more than 90% of its electricity from coal plants. Neither state has turned to renewable-energy generation, owing mainly to outdated public-policy hurdles.
SEVERAL IMPRESSIVE METRICS ARE DETAILED IN A REPORT published last month by Wood Mackenzie and the Solar Energy Industries Association. Three indicators in particular show how utility-scale momentum is gaining speed:
- One: A boom in the U.S. solar project pipeline that will double national capacity in five years—following worries that proved unfounded last year that the Trump administration would impose crippling tariffs on solar-panel imports.
- Two: A medium-term doubling of installed solar-photovoltaic capacity, a trend that will support 14GW of capacity installations annually by 2023.
- Three: A recent acceleration of solar investments that is expected to make the fourth quarter of 2019 the biggest U.S. quarter for solar installations on record.
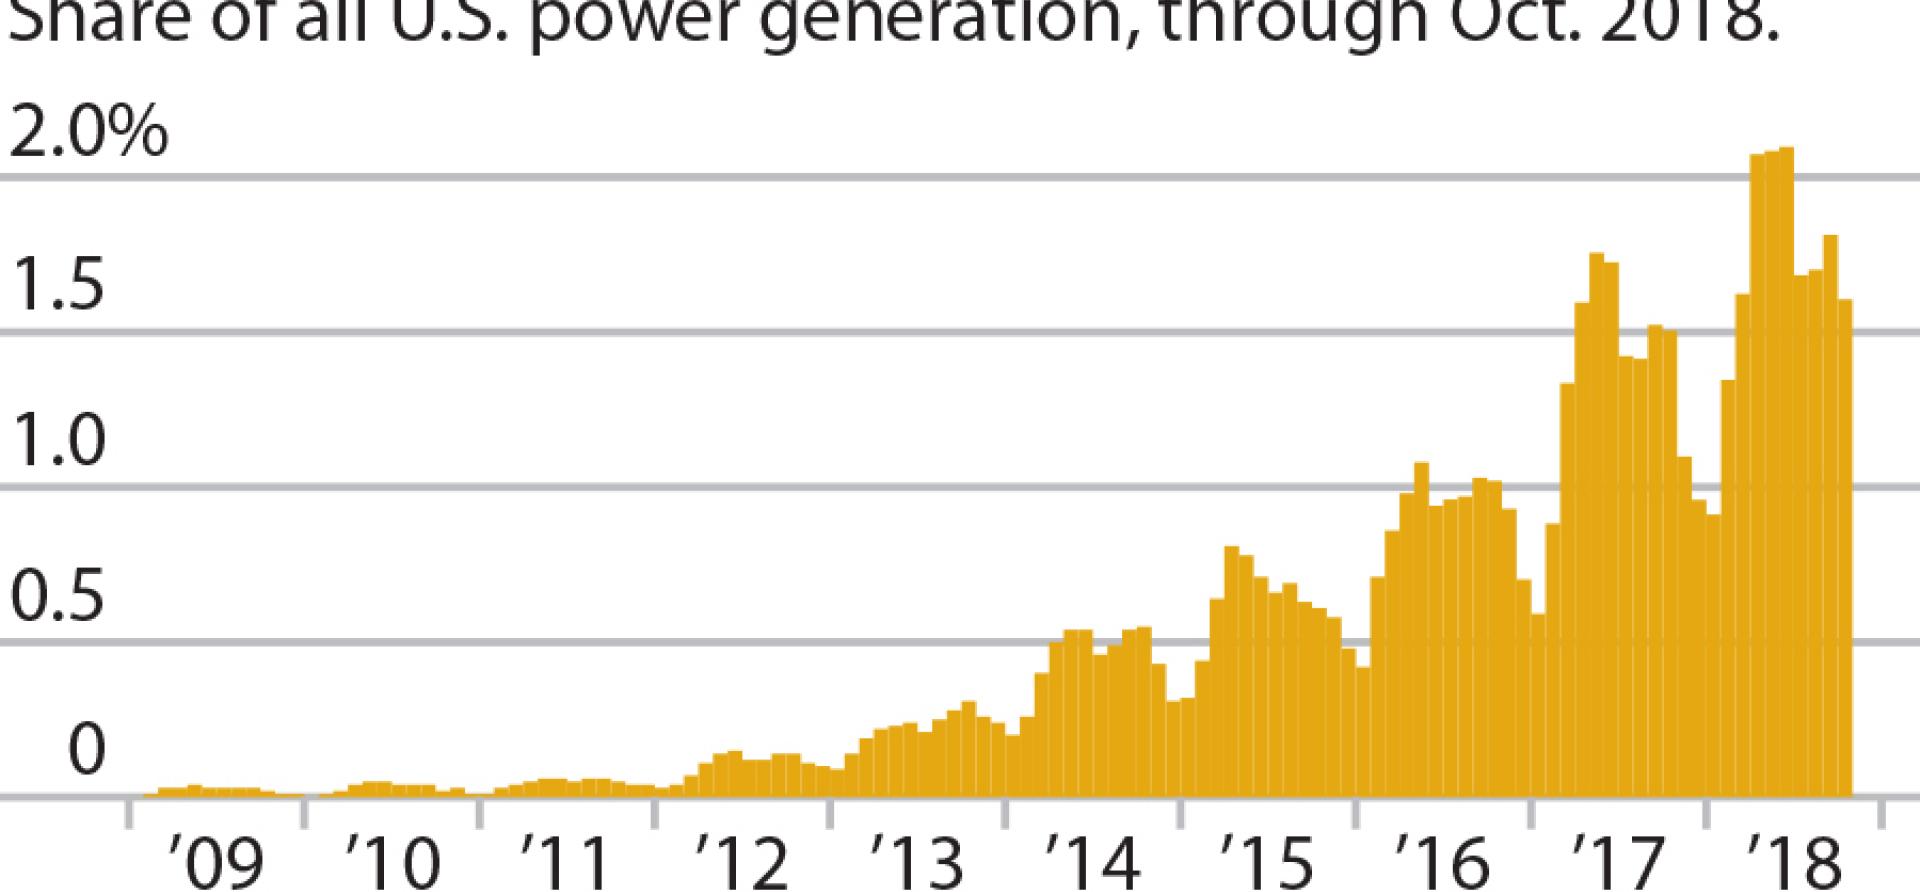
The report notes, importantly, that over the past four years virtually all U.S. electricity-generation capacity has been from solar, wind, or natural gas—with solar accounting for about one-third of the total each year—a trend made even more remarkable by the fact that it has weathered, even prevailed over, major federal policy uncertainties.
Prices in renewables, in the meantime, have continued to drop, which the report places at historic lows across various regional markets. In just the past year, the installed cost of fixed-tilt projects, the most basic of utility-scale solar power plants, fell by 3.3%, to $0.93/watt, while single-axis tracking systems fell by 2.9%, to $1.04/watt.
The report sees enormous potential fueled by policy modernization, predicting that by 2020, Illinois, Maryland, and New York —“the next wave of states with robust community solar mandates” — will “begin to see the realization of [project] pipelines” and that nonresidential electricity users will be tapping solar-battery sources. The report pegs 28 states by next year with solar markets of 100MW or greater, 25 of them with at least 1,000MW, a giant leap over 2010, when only two states had solar markets of 100MW or more.
The U.S. today has 33.7GW of solar-photovoltaic capacity, but the pipelines described in the Wood Mackenzie/SEIA report, including 4.4GW of utility-scale solar already under construction and 22.5GW with signed power-purchase agreements, stands to push the total over 60GW by 2023.
And that does not take into account an even larger wave of projects, some 38.7GW in all, that have been announced but are still in the pre-contract phase.
Seth Feaster is an IEEFA data analyst. Karl Cates is an IEEFA research editor.
Related items:
IEEFA U.S.: A sea change in American offshore wind
IEEFA Europe: Progressive energy policies will make rooftop solar more affordable
IEEFA U.S.: Transition to renewables has taken hold in historically coal-dependent northern Indiana

Related Content