IHS Research has released an update on its global solar installation data that is well worth a look. Here are their year-by-year numbers:
- 46 GW in 2014
- 58 GW in 2015 (+26 percent year over year)
- 67GW in 2016 (+16 percent year over year)
- 71.5GW in 2017 to (+7 percent year over year)
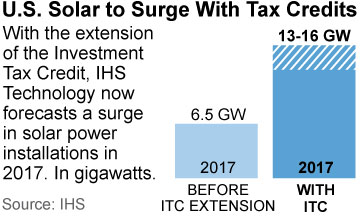
The latest change on the outlook in the U.S. has 2016 downgraded to 13GW (from 17GW due to the overbuild prior to the expected two-thirds reduction of the tax credit) and 2017 upgraded to 15GW (previously 6-7GW) to reflect the passing in December of the of the federal investment tax credit extension. This major development surprised the market in December shortly after the global climate-change summit in Paris, giving the already well-established U.S. electricity sector transformation a major boost. With gas-, wind- and solar-installation activity all running at record high rates in the U.S., coal-fired power plant retirements will continue to positively surprise.
IHS forecasts are broadly consistent with IEEFA’s, which see 56GW in 2015, 65GW in 2016 and 72GW in 2017. Within this outlook:
- IEEFA expects China to install 16-17GW in 2015 (after only 11-12GW in 2014), and possibly expanding further to 20GW per annum from 2016;
- IEEFA expects India to install 2.2GW in calendar-year 2015 (after only 1GW in 2014), and a more than doubling to 5GW in 2016 (in year-to-March terms, this is 2.6GW in 2015-16, rising to 5.8GW in 2016-17 and 9.2GW in 2017-18); and
- IEEFA expects Japan to continue installing 8-10GW per year over 2015-2017.
Global solar development involves an ever larger number of countries pursuing electricity-sector diversification into solar, with major new markets emerging now in Chile, Brazil, France and Africa. The Philippines is currently installing the largest solar project it has ever undertaken, a 132MW facility in Cadiz City.
THIS BROAD MOMENTUM WILL CONTINUE TO DRIVE ALL-IN SOLAR ELECTRICITY COSTS DOWN 5-10 PERCENT PER ANNUM, EATING FURTHER INTO THERMAL COAL’S EVER-SMALLER SHARE OF THE PIE. While much of the discussion in renewables revolves around the more dynamic solar sector, it is worth noting too that the global listed wind sector outperformed dramatically, rising by an average 40 percent in the calendar year of 2015, with European wind turbine manufacturers up 116 percent. This is important given that the global electricity sector transformation requires multiple levers including wind, solar, hydro, grid and energy efficiency to deliver sufficient momentum to continue to displace coal.
At an investor-day event in December, the U.S. company SolarCity highlighted how all new U.S. installs have averaged 15-20GW annually of gross new generation capacity since 2010. Of this, distributed solar represented 22 percent of total installs the first half of calendar year 2014 (with installed capacity growing at a compound annual growth rate of 40 percent since 2010), and utility scale solar another 23 percent—so solar was 45% of total gross capacity installs in the U.S. SolarCity forecasts install volume growth guidance of 43 percent year over year in 2016, and targets total installed cost to decline an additional 20 percent from the 2015 third-quarter realized average of US$2.84/w to a target of US$2.25/w.
Tim Buckley is IEEFA’s director of energy finance analysis, Australasia.


