IEEFA U.S.: Surging generation from solar, wind on track to push renewable market share to 30 percent by 2026

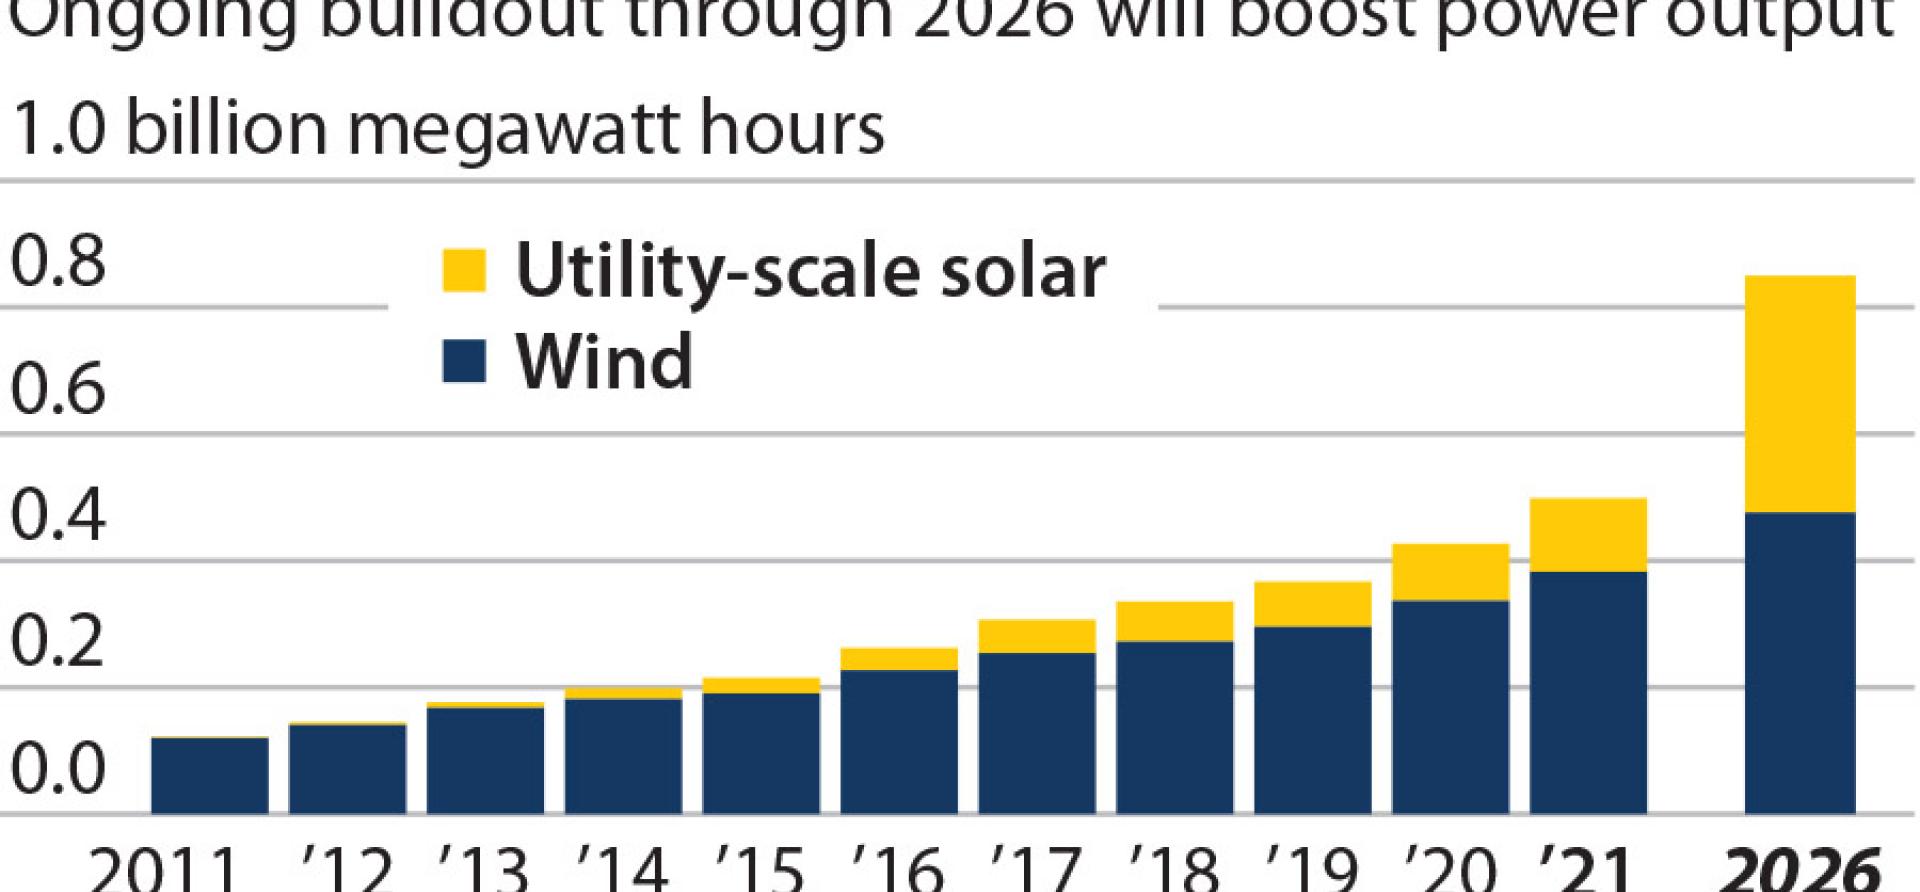
Data for the first eight months of this year show that wind generation has risen more than 25 percent since 2019 (pushing its market share to almost 9 percent) while utility-scale solar generation has jumped 55 percent (pushing its market share to nearly 3 percent). Combined, wind and utility-scale solar generation has gone up by 76 million megawatt-hours (MWh)—a 31 percent increase—while coal and gas generation has fallen by 1.6 percent since 2019, reflecting the ongoing transition of electricity markets to renewable energy and away from fossil fuels.
 But an even bigger surge in renewable generation is coming soon. IEEFA estimates that by the end of 2026—just five years from now—wind and utility-scale solar will generate roughly 850 million MWh of electricity annually, equal to more than 21 percent of total 2020 demand.
The increase in utility-solar generation in the past two years was driven by the installation of roughly 22,500 megawatts of new capacity. The Solar Energy Industries Association now expects utility-scale installations to average more than 21,000MW a year through 2026, with a peak of 25,000MW in 2023.
These new solar projects could be generating an additional 283 million MWh of power a year by the end of 2026—more than triple the full-year 2020 level of 90.1 million MWh—for a total of 374 million MWh. Assuming that total U.S. electricity demand remains essentially flat, as it has since 2010, this would push solar’s share of overall demand to about 9.3 percent. In terms of capacity, the buildout will add roughly 129.5 gigawatts (GW) of utility-scale solar generation to the U.S. grid
Coal and natural gas are now locked into an essentially zero-sum game
Continued growth is also expected in U.S. wind generation, with 37.7GW of new capacity already under construction or in advanced development, which would be added to 127.8GW in existing installed capacity. The new wind power could add 138.7 million MWh of electricity a year, an increase of 41 percent by 2026, and pushing wind’s total to 476 million MWh.
For these generation estimates, IEEFA assumed conservative capacity factors of 25 percent for new utility-scale solar and 42 percent for new wind. Capacity factors reflect how much of the maximum potential generation is actually produced. Every type of power source, including fossil fuels, has its own unique limitations, and most operate in response to variable demand and competitive markets.
Coal and natural gas are now locked into an essentially zero-sum game where increases in one fuel’s generation comes at the expense of the other. Together, they are not gaining market share, rather they are trading it back and forth, and the rapid growth in renewable generation will cut even deeper into the market share of both.
The current boom in utility-scale solar and wind is similar—but probably bigger and more durable.
For example, in 2020, when gas prices were very low and power demand dropped significantly as a result of the pandemic, coal generation’s market share fell to just 19.9 percent. This year, with a rebound in power demand and a sharp rise in gas prices, coal generation has risen through August—but it is still below 2019 levels and unlikely to top that mark. Gas generation is down from 2020’s level, but more remarkably, is also slightly lower than 2019. Combined, gas and coal’s share of U.S. generation was 60.2 percent for the first eight months of 2021, down from 61.2 percent for the same period in 2019. A decade ago, in 2011, coal and gas together accounted for 67 percent of total demand.
By 2026, assuming overall electricity demand in the U.S. stays flat, the market share of coal and gas is likely to have fallen well below 55 percent.
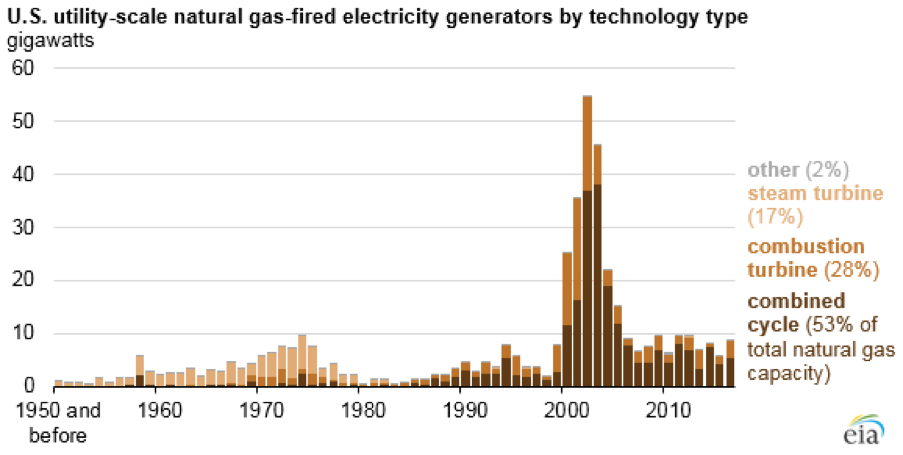
For anyone that doubts such a wind and solar buildout is possible, consider what happened between 2001 and 2006—even before the huge volumes of cheap gas from the fracking boom arrived. In that short period of time, the U.S. added close to 200GW of gas-fired capacity to its then much-smaller grid, with about 133GW of that being combined cycle gas turbine facilities.
The current boom in utility-scale solar and wind is similar—but probably bigger and more durable. Solar projects are being built in nearly every corner of the country, by a multitude of independent developers, utilities and communities, and can range in scale from a megawatt in power covering a few acres to those in the hundreds of megawatts covering a square mile or more. Likewise, major wind projects continue to be built across the Great Plains from Texas to Wyoming, but the enormous potential of offshore wind from North Carolina to Massachusetts is just beginning to be developed.
Adding hydro to the mix, even accounting for generation declines going forward because of drought in the West, only heightens the scale of the renewable transition. For the past five years, hydro generation has averaged 287.9 million MWh annually. Reducing this by 20 percent would cut annual output to 230.3 million MWh.
The energy transition of America’s power markets continues to accelerate
What’s more, all of the growth figures above, which are focused on utility-scale power projects, do not include rooftop solar installations, another rapidly growing sector of power generation that barely existed a few years ago. EIA estimates that this “small-scale solar” produced 41.7 million MWh of power in 2020, a 19 percent increase from 2019. This growth will likely continue in the years ahead as costs continue to fall and concerns about grid reliability rise. Assuming a conservative 15 percent annual increase in small-scale solar going forward would push the sector’s generation to almost 100 million MWh in 2026.
Together, these renewable resources will soon be pumping approximately 1,180 million MWh into the grid—just under 30 percent of total U.S. demand.
The bottom line: The energy transition of America’s power markets continues to accelerate, with renewables relentlessly increasing market share. And as the cost of coal- and gas-fired power rises from the current jump in fossil fuel prices, the economic advantage of renewables will become even more compelling.
Dennis Wamsted ([email protected]) is an IEEFA analyst/editor.
Seth Feaster ([email protected]) is an IEEFA energy data analyst.
Related Items:
IEEFA U.S.: The Texas transition gains momentum, May 2021
IEEFA U.S.: The coal-to-renewables transition takes off, May 2021
IEEFA: Birchwood coal facility closure/redevelopment highlights transition from coal to renewables, April 2021